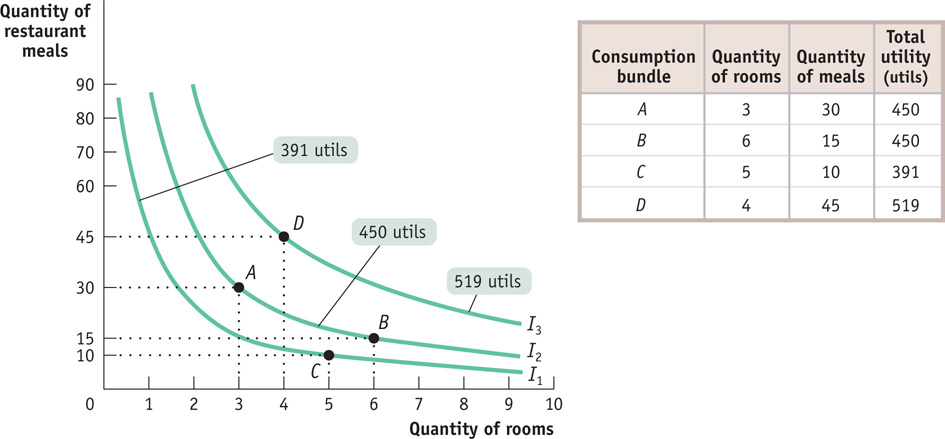
Figure10A- 3 An Indifference Curve Map The utility function can be represented in greater detail by increasing the number of indifference curves drawn, each corresponding to a different level of total utility. In this figure bundle C lies on an indifference curve corresponding to a total utility of 391 utils. As in Figure 10A-2, bundles A and B lie on an indifference curve corresponding to a total utility of 450 utils. Bundle D lies on an indifference curve corresponding to a total utility of 519 utils. Ingrid prefers any bundle on I2 to any bundle on I1, and she prefers any bundle on I3 to any bundle on I2.