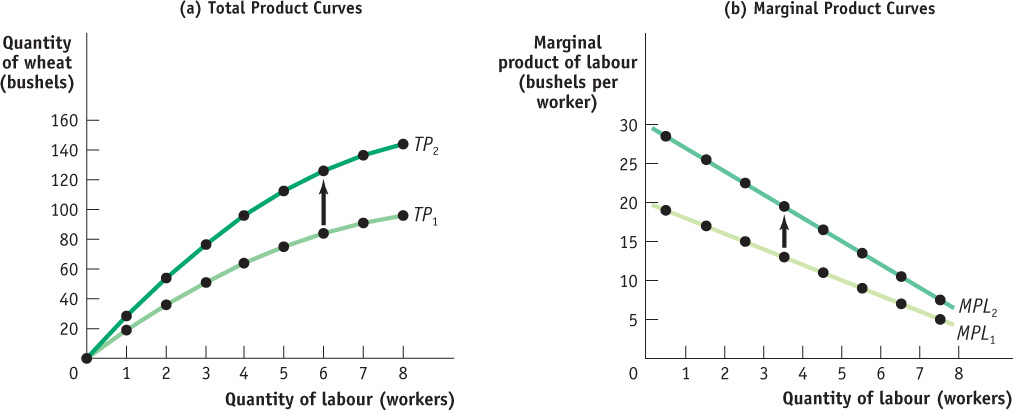
Figure11-3Total Product, Marginal Product, and the Fixed Input This figure shows how the quantity of output and the marginal product of labour depend on the level of the fixed input and a given state of technology. Panel (a) shows two total product curves for Alec and Janet’s farm, TP1 when their farm is 1 hectare and TP2 when it is 2 hectares. With more land, each worker can produce more wheat. So an increase in the fixed input shifts the total product curve up from TP1 to TP2. This implies that the marginal product of each worker is higher when the farm is 2 hectares than when it is 1 hectare. Panel (b) shows the marginal product of labour curves. The increase in land also shifts the marginal product of labour curve up from MPL1 to MPL2. Note that both marginal product of labour curves still slope downward due to diminishing returns to labour. Likewise, if there is an improvement in production technique, both the total product curve and marginal product of labour curve will shift upwards.