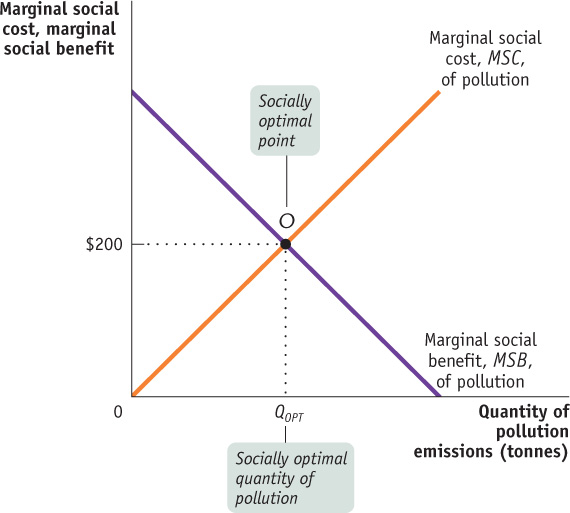
Figure16-1The Socially Optimal Quantity of Pollution Pollution yields both costs and benefits. Here the MSC curve shows how the marginal cost to society as a whole from emitting one more tonne of pollution emissions depends on the quantity of emissions. The MSB curve shows how the marginal benefit to society as a whole of emitting an additional tonne of pollution emissions depends on the quantity of pollution emissions. The socially optimal quantity of pollution is QOPT; at that quantity, the marginal social benefit of pollution is equal to the marginal social cost, corresponding to $200.