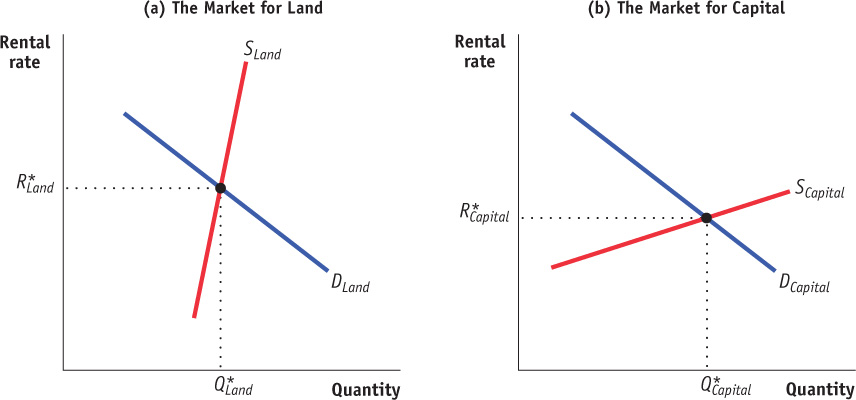
Figure19-7Equilibria in the Land and Capital Markets Panel (a) illustrates equilibrium in the rental market for land; panel (b) illustrates equilibrium in the rental market for capital. The supply curve for land is relatively steep, reflecting the high cost of increasing the quantity of productive land. The supply curve for capital, in contrast, is relatively flat, due to the relatively high responsiveness of savings to changes in the rental rate for capital. The equilibrium rental rates for land and capital, as well as the equilibrium quantities transacted, are given by the intersections of the demand and supply curves. In a competitive land market, each unit of land will be paid the equilibrium value of the marginal product of land, R*Land. Likewise, in a competitive capital market, each unit of capital will be paid the equilibrium value of the marginal product of capital, R*Capital.