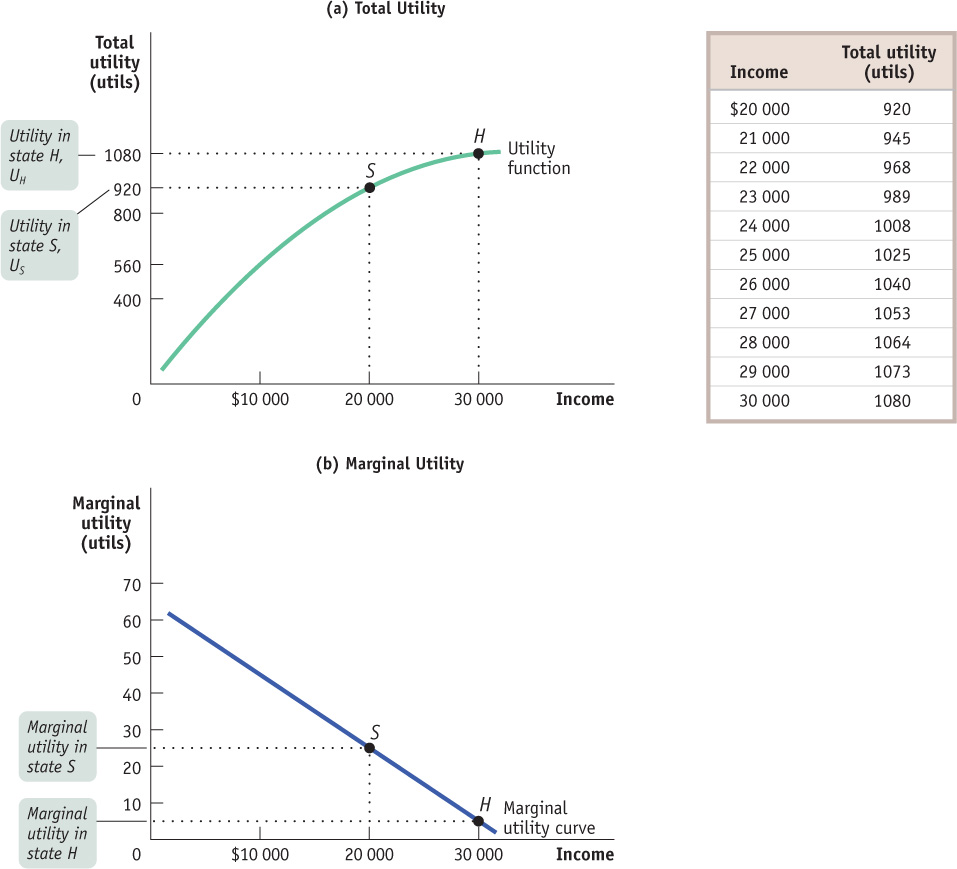
Figure20-1The Utility Function and Marginal Utility Curve of a Risk- Averse Family Panel (a) shows how the total utility of the Lee family depends on its income available for consumption (that is, its income after medical expenses). The curve slopes upward: more income leads to higher total utility. But it gets flatter as we move up it and to the right, reflecting diminishing marginal utility. Panel (b) reflects the negative relationship between income and marginal utility when there is risk aversion: the marginal utility from each additional $1000 of income is lower the higher your income. So the marginal utility of income is higher when the family has high medical expenses (point S) than when it has low medical expenses (point H).