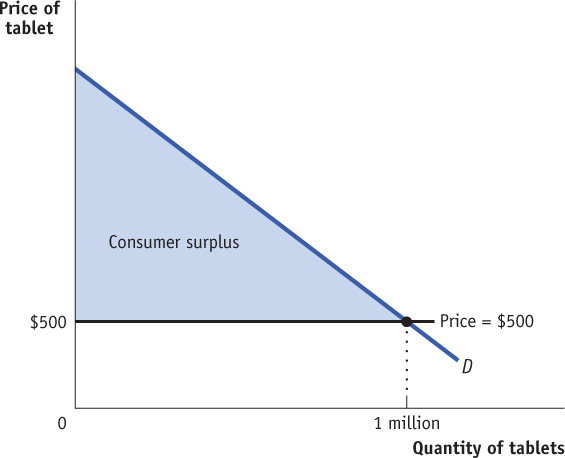
Figure4-3Consumer Surplus The demand curve for tablets is smooth because there are many potential buyers. At a price of $500, 1 million tablets are demanded. The consumer surplus at this price is equal to the shaded area: the area below the demand curve but above the price. This is the total net gain to consumers generated from buying and consuming tablets when the price is $500.
All other things equal, a shift in the demand curve will lead to a change in the consumer surplus. For example, an increase in the demand for tablets increases the consumer surplus for any given price level, as the maximum willingness to pay rises. In the graph, as the demand curve shifts right, the shaded area gets larger.
All other things equal, a shift in the demand curve will lead to a change in the consumer surplus. For example, an increase in the demand for tablets increases the consumer surplus for any given price level, as the maximum willingness to pay rises. In the graph, as the demand curve shifts right, the shaded area gets larger.