17.2 Public Goods
A public good is both nonexcludable and nonrival in consumption.
A public good is the exact opposite of a private good: it is a good that is both nonexcludable and nonrival in consumption. A public sewer system is an example of a public good: you can’t keep a river clean without making it clean for everyone who lives near its banks, and my protection from great stinks does not come at my neighbour’s expense.
Here are some other examples of public goods:
Disease prevention. When doctors act to stamp out the beginnings of an epidemic before it can spread, they protect people around the world.
Scientific research. More knowledge benefits everyone.
National defence. A strong military protects all citizens.
Because these goods are nonexcludable, they suffer from the free-
Providing Public Goods
Public goods are provided through a variety of means. The government doesn’t always get involved—
Some public goods are supplied through voluntary contributions. For example, private donations support a considerable amount of scientific research. But private donations are insufficient to finance huge, socially important projects like basic medical research.
Some public goods are supplied by self-
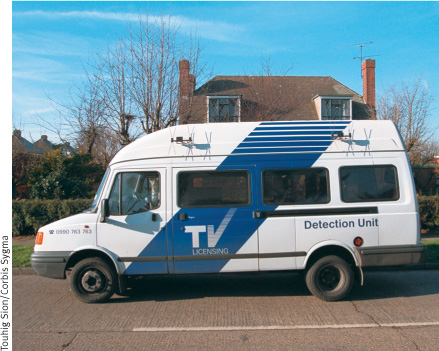
Some potentially public goods are deliberately made excludable and therefore subject to charge, like on-
In small communities, a high level of social encouragement or pressure can be brought to bear on people to contribute money or time to provide the efficient level of a public good. Volunteer fire departments, which depend both on the volunteered services of the firefighters themselves and on contributions from local residents, are a good example. But as communities grow larger and more anonymous, social pressure is increasingly difficult to apply, compelling larger towns and cities to tax residents to provide salaried firefighters for fire protection services.
As this last example suggests, when these other solutions fail, it is up to the government to provide public goods. Indeed, the most important public goods—
How Much of a Public Good Should Be Provided?
In some cases, provision of a public good is an “either–
Imagine a city in which there are only two residents, Ted and Alice. Assume that the public good in question is street cleaning and that Ted and Alice truthfully tell the government how much they value a unit of the public good, where a unit is equal to one street cleaning per month. Specifically, each of them tells the government his or her willingness to pay for another unit of the public good supplied—an amount that corresponds to that individual’s marginal benefit of another unit of the public good.
Using this information plus information on the cost of providing the good, the government can use marginal analysis to find the efficient level of providing the public good: the level at which the marginal social benefit of the public good is equal to the marginal cost of producing it. Recall from Chapter 16 that the marginal social benefit of a good is the benefit that accrues to society as a whole from the consumption of one additional unit of the good.
But what is the marginal social benefit of another unit of a public good—
Why? Because a public good is nonrival in consumption—
Figure 17-2 illustrates the efficient provision of a public good, showing three marginal benefit curves. Panel (a) shows Ted’s individual marginal benefit curve from street cleaning, MBT: he would be willing to pay $25 for the city to clean its streets once a month, an additional $18 to have it done a second time, and so on. Panel (b) shows Alice’s individual marginal benefit curve from street cleaning, MBA. Panel (c) shows the marginal social benefit curve from street cleaning, MSB: it is the vertical sum of Ted’s and Alice’s individual marginal benefit curves, MBT and MBA.
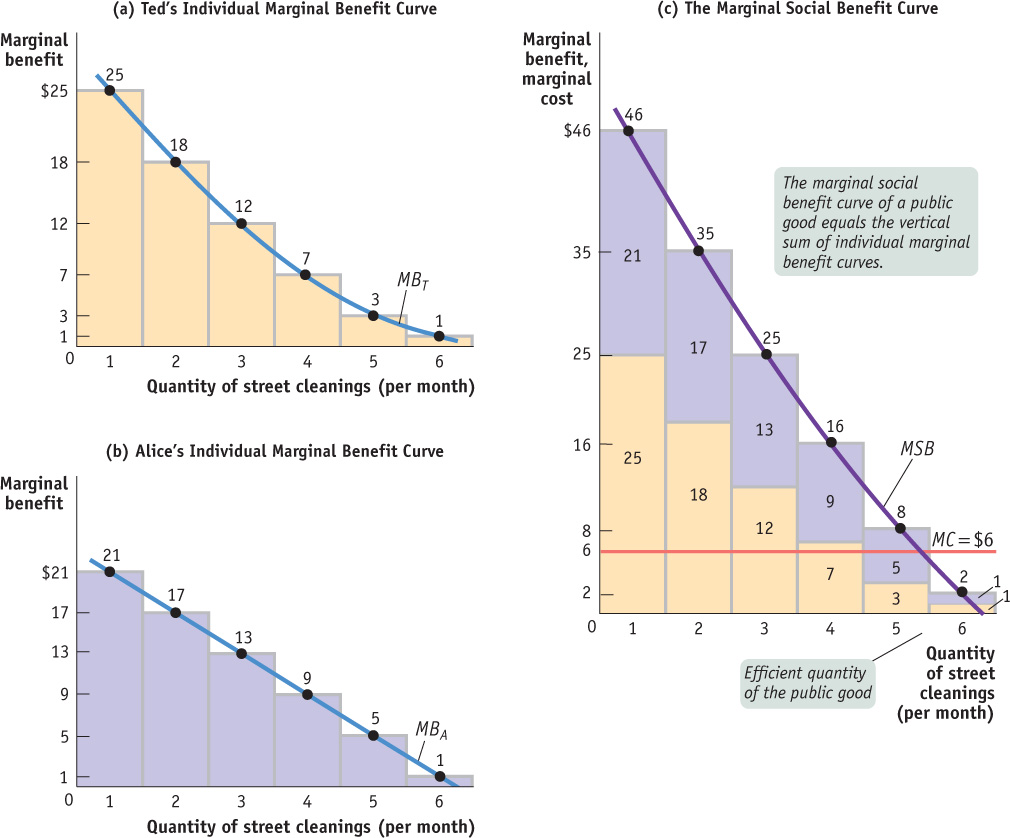
To maximize society’s welfare, the government should clean the street up to the level at which the marginal social benefit of an additional cleaning is no longer greater than the marginal cost. Suppose that the marginal cost of street cleaning is $6 per cleaning. Then the city should clean its streets 5 times per month, because the marginal social benefit of going from 4 to 5 cleanings is $8, but going from 5 to 6 cleanings would yield a marginal social benefit of only $2.
Figure 17-2 can help reinforce our understanding of why we cannot rely on individual self-
Does this description of the public-
The problem of providing public goods is very similar to the problem of dealing with positive externalities; in both cases there is a market failure that calls for government intervention. One basic rationale for the existence of government is that it provides a way for citizens to tax themselves in order to provide public goods—
Of course, if society really consisted of only two individuals, they would probably manage to strike a deal to provide the good. But imagine a city with a million residents, each of whose individual marginal benefit from provision of the good is only a tiny fraction of the marginal social benefit. It would be impossible for people to reach a voluntary agreement to pay for the efficient level of street cleaning—
VOTING AS A PUBLIC GOOD
It’s a sad fact that many Canadians who are eligible to vote don’t bother to. As a result, their interests tend to be ignored by politicians. But what’s even sadder is that this self-
As the economist Mancur Olson pointed out in a famous book titled The Logic of Collective Action, voting is a public good, one that suffers from severe free-
Imagine that you are one of a million people who would stand to gain the equivalent of $100 each if some plan is passed in a province-
Of course, many people do vote out of a sense of civic duty. But because political action is a public good, in general people devote too little effort to defending their own interests.
The result, Olson pointed out, is that when a large group of people share a common political interest, they are likely to exert too little effort promoting their cause and so will be ignored. Conversely, small, well-
Is this a reason to distrust democracy? Winston Churchill said it best: “Democracy is the worst form of government, except for all the other forms that have been tried.”
VOTING AS A PUBLIC GOOD: THE GLOBAL PERSPECTIVE
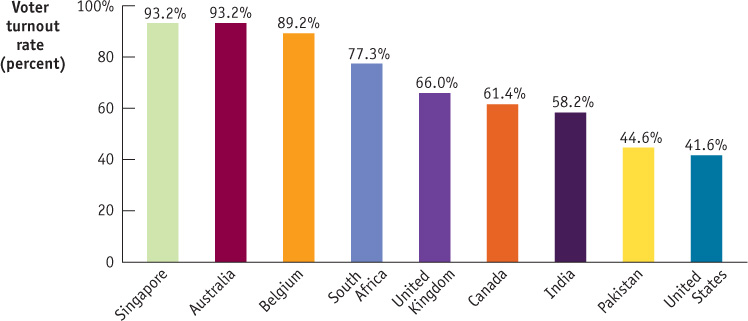
Despite the fact that it can be an entirely rational choice not to vote, many countries consistently achieve astonishingly high turnout rates in their elections by adopting policies that encourage voting. In Belgium, Singapore, and Australia, voting is compulsory; eligible voters are penalized if they fail to do their civic duty by casting their ballots. These penalties are effective at getting out the vote. When Venezuela dropped its mandatory voting requirement, the turnout rate dropped 30%; when the Netherlands did the same, there was a 20% drop-
Other countries have policies that reduce the cost of voting; for example, declaring election day a work holiday (giving citizens ample time to cast their ballots), allowing voter registration on election day (eliminating the need for advance planning), and permitting voting by mail (increasing convenience).
This figure shows turnout rates in several countries, measured as the percentage of eligible voters who cast ballots, averaged over elections held between 1945 and 2008. As you can see, Singapore, Australia, and Belgium have the highest voter turnout rates. Canada, however, does not fare well: our voter turnout rate was just above 61%, well below many other countries. In general, the past four decades have seen a decline in voter turnout rates in the major democracies, most dramatically among the youngest voters.
Cost-Benefit Analysis
How do governments decide in practice how much of a public good to provide? Sometimes policy-makers just guess—or do whatever they think will get them re-elected. However, responsible governments try to estimate and compare both the social benefits and the social costs of providing a public good, a process known as cost-benefit analysis.
Cost-benefit analysis is the estimation and comparison of the social costs and social benefits of providing a public good.
It’s straightforward to estimate the cost of supplying a public good. Estimating the benefit is harder. In fact, it is a very difficult problem.
Now you might wonder why governments can’t figure out the marginal social benefit of a public good just by asking people their willingness to pay for it (their individual marginal benefit). But it turns out that it’s hard to get an honest answer.
This is not a problem with private goods: we can determine how much an individual is willing to pay for one more unit of a private good by looking at his or her actual choices. But because people don’t actually pay for public goods, the question of willingness to pay is always hypothetical.
Worse yet, it’s a question that people have an incentive not to answer truthfully. People naturally want more rather than less. Because they cannot be made to pay for whatever quantity of the public good they use, people are apt to overstate their true feelings when asked how much they desire a public good. For example, if street cleaning were scheduled according to the stated wishes of homeowners alone, the streets would be cleaned every day—an inefficient level of provision.
So governments must be aware that they cannot simply rely on the public’s statements when deciding how much of a public good to provide—if they do, they are likely to provide too much. In contrast, as For Inquiring Minds in the preceding section explains, relying on the public to indicate how much of the public good they want through voting has problems as well—and is likely to lead to too little of the public good being provided.
THE ST. LAWRENCE SEAWAY
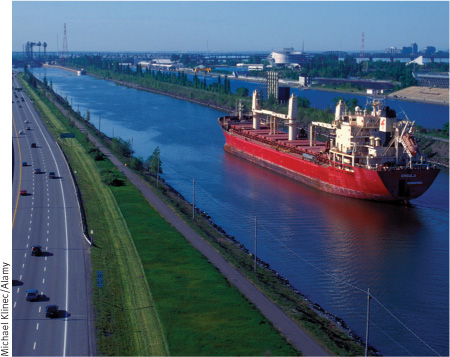
The St. Lawrence River plays an important role in the economic development of Canada by connecting the Great Lakes to the Atlantic Ocean. To further promote international trade and to allow larger vessels to get better access to the populated inland market, discussions between Canada and the United States began in the late 1940s on the feasibility of a joint project to build a deeper waterway on the St. Lawrence River. An agreement was reached in 1954, which led to the construction of the St. Lawrence Seaway, a system of locks, canals, and channels that allow ocean-going vessels to navigate from the Atlantic Ocean to the Great Lakes. The Seaway, which officially opened in 1959, cost $470.3 million to build (more than $7 billion in today’s dollars). Canada covered about 70% of the cost because most of the locks are located in Canada, and the United States paid the rest.
The opening of this expanded St. Lawrence Seaway had major economic impacts on both countries. By deepening the waterway and allowing large ocean-going vessels access to the Great Lakes, it essentially lowered the freight rates for bulk commodities, which lowered production costs for many industries.
Since its opening, the tonnage of cargo going through the St. Lawrence Seaway has increased significantly from an annual average of 10 million tonnes in the 1950s to 40 million tonnes in recent years. According to the St. Lawrence Seaway Management Corporation, the Seaway moved more than 2.5 billion tonnes of cargo in the 50 years since it opened, with an estimated value of more than $375 billion. A report on the economic impact of the St. Lawrence Seaway estimated that in 2010 the Seaway generated a total of 98 556 jobs in Canada.1 The St. Lawrence Seaway is a good example of how the provision of a public good by the government can have a huge positive impact on the economy. If the new locks and canals had not been built in the 1950s, we would still see smaller cargo ships travel along the St. Lawrence River but we would not have the shipping magnitudes and number of jobs created that we have today.

Quick Review
A public good is both nonexcludable and nonrival in consumption.
Because most forms of public-good provision by the private sector have serious defects, they are typically provided by the government and paid for with taxes.
The marginal social benefit of an additional unit of a public good is equal to the sum of each consumer’s individual marginal benefit from that unit. At the efficient quantity, the marginal social benefit equals the marginal cost of providing the good.
No individual has an incentive to pay for providing the efficient quantity of a public good because each individual’s marginal benefit is less than the marginal social benefit. This is a primary justification for the existence of government.
Although governments should rely on cost-benefit analysis to determine how much of a public good to supply, doing so is problematic because individuals tend to overstate the good’s value to them.
Check Your Understanding 17-2
CHECK YOUR UNDERSTANDING 17-2
Question 17.3
The town of Centreville, population 16, has two types of residents, Homebodies and Revellers. Using the accompanying table, the town must decide how much to spend on its New Year’s Eve party. No individual resident expects to directly bear the cost of the party.
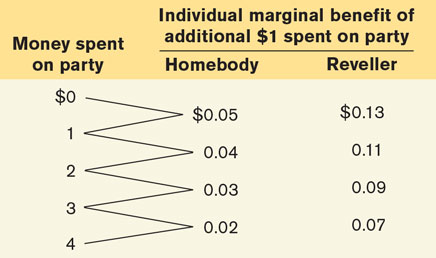
Suppose there are 10 Homebodies and 6 Revellers. Determine the marginal social benefit schedule of money spent on the party. What is the efficient level of spending?
Suppose there are 6 Homebodies and 10 Revellers. How do your answers to part (a) change? Explain.
Suppose that the individual marginal benefit schedules are known but no one knows the true proportion of Homebodies versus Revellers. Individuals are asked their preferences. What is the likely outcome if each person assumes that others will pay for any additional amount of the public good? Why is it likely to result in an inefficiently high level of spending? Explain.
With 10 Homebodies and 6 Revellers, the marginal social benefit schedule of money spent on the party is as shown in the accompanying table.
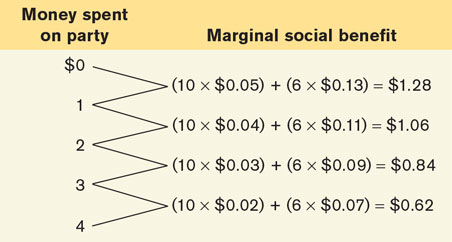
The efficient spending level is $2, the highest level for which the marginal social benefit is greater than the marginal cost ($1).
With 6 Homebodies and 10 Revellers, the marginal social benefit schedule of money spent on the party is as shown in the accompanying table.
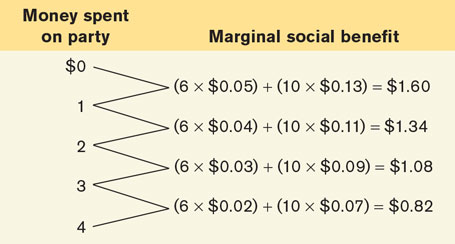
The efficient spending level is now $3, the highest level for which the marginal social benefit is greater than the marginal cost ($1). The efficient level of spending has increased from that in part (a) because with relatively more Revellers than Homebodies, an additional dollar spent on the party generates a higher level of social benefit compared to when there are relatively more Homebodies than Revellers.
When the numbers of Homebodies and Revellers are unknown but residents are asked their preferences, Homebodies will pretend to be Revellers to induce a higher level of spending on the public party. That’s because a Homebody still receives a positive individual marginal benefit from an additional $1 spent, despite the fact that his or her individual marginal benefit is lower than that of a Reveller for every additional $1. In this case the “reported” marginal social benefit schedule of money spent on the party will be as shown in the accompanying table.
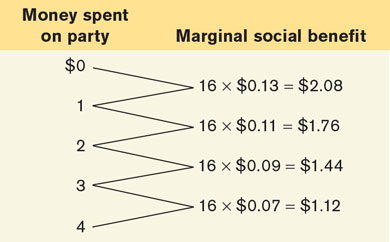
As a result, $4 will be spent on the party, the highest level for which the “reported” marginal social benefit is greater than the marginal cost ($1). Regardless of whether there are 10 Homebodies and 6 Revellers, as in part (a), or 6 Homebodies and 10 Revellers, as in part (b), spending $4 in total on the party is clearly inefficient because marginal cost exceeds marginal social benefit at this spending level.
As a further exercise, consider how much Homebodies gain by this misrepresentation. In part (a), the efficient level of spending is $2. So by misrepresenting their preferences, the 10 Homebodies gain, in total, 10 × ($0.03 + $0.02) = $0.50—that is, they gain the marginal individual benefit in going from a spending level of $2 to $4. The 6 Revellers also gain from the misrepresentations of the Homebodies; they gain 6 × ($0.09 + $0.07) = $0.96 in total. This outcome is clearly inefficient—when $4 in total is spent, the marginal cost is $1 but the marginal social benefit of the last $1 spent is only $0.62, indicating that too much money is being spent on the party.
According to part (b), the efficient level of spending is actually $3. The misrepresentation by the 6 Homebodies gains them, in total, 6 × $0.02 = $0.12, but the 10 Revellers gain 10 × $0.07 = $0.70 in total. This outcome is also clearly inefficient—when $4 is spent, marginal social benefit is only $0.12 + $0.70 = $0.82 but marginal cost is $1.