Chapter 1. SP_Chiang_Chapter03_002
Step 1
Solved Problems
true
true
You must read each slide, and complete any questions on the slide, in sequence.
The following graph represents the supply (S) and demand (D) for orange juice.
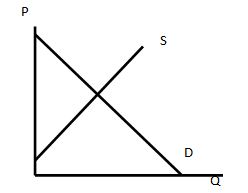
If bad weather harms orange groves in Florida:
a. The curve shifts because are mainly affected.
Oranges are used in making orange juice, so producers will be primarily affected.
Oranges are used in making orange juice, so producers will be primarily affected.
b. This curve shifts because
Oranges are an input in producing orange juice.
Oranges are an input in producing orange juice.
c. This curve shifts because input costs go up.
Rising input prices shift the supply curve left, and decreasing input prices shift it right.
Rising input prices shift the supply curve left, and decreasing input prices shift it right.
d. As a result, the equilibrium price of orange juice will .
As might be expected, higher costs for producers mean higher prices for consumers, which is consistent with a leftward shift of the supply curve.
As might be expected, higher costs for producers mean higher prices for consumers, which is consistent with a leftward shift of the supply curve.
e. Likewise, the equilibrium quantity of orange juice will .
As might be expected, fewer oranges mean lesser orange juice, which is consistent with a leftward shift of the supply curve.
As might be expected, fewer oranges mean lesser orange juice, which is consistent with a leftward shift of the supply curve.