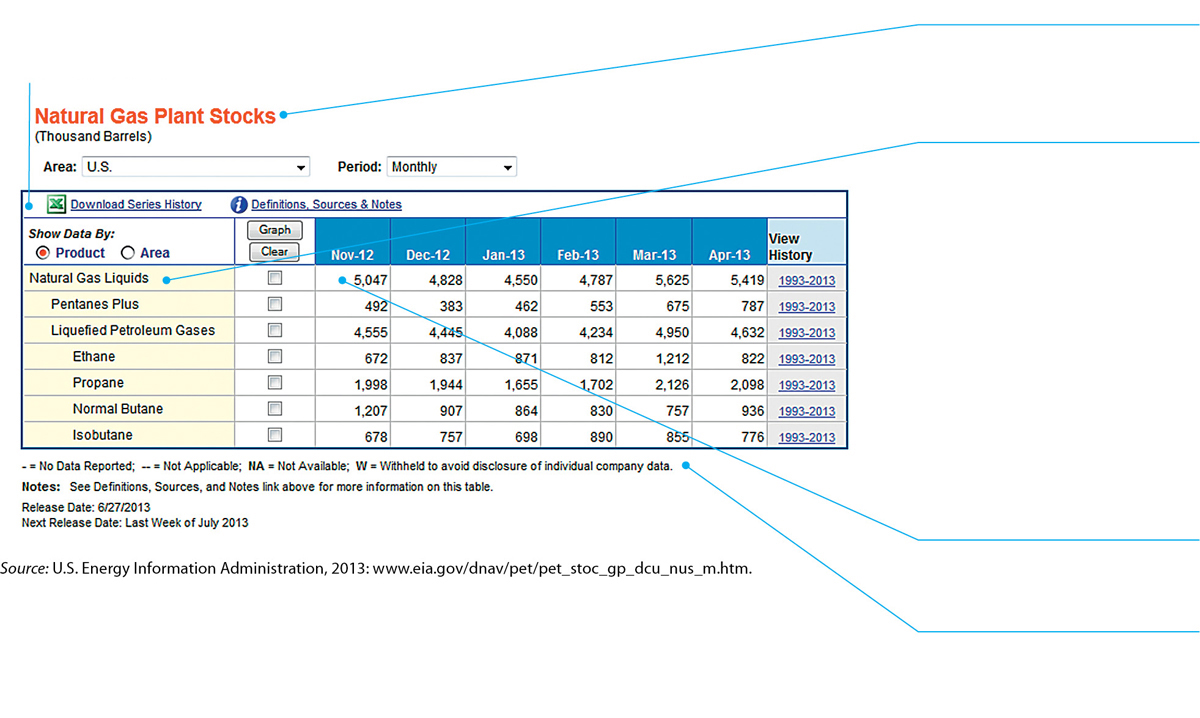
FIGURE 8.7 Parts of a Table
This is an interactive table from the Energy Information Administration showing the amount of natural gas stocks in the United States over a six-month period. Note that you can use the radio buttons to show the data by location or product, and you can use the pull-down menu to specify a time frame. Even though this table is interactive, it functions much the way any table does.
The data in this table consist of numbers, but tables can also present textual information or a combination of numbers and text.
Tables are usually titled at the top because readers scan them from top to bottom.
Some tables include a stub head. The stub—the left-hand column— lists the items for which data are displayed. Note that indentation in the stub helps show relationships. The heading “Natural Gas Liquids” is left-aligned. This row functions as a Totals row. Indented beneath this heading are the two categories that make up the totals: pentanes plus and liquefied petroleum gases. Beneath the heading are rows for the four kinds of liquefied petroleum gases.
Note that the numbers are right aligned.
Note that tables often contain one or more source statements and footnotes.