TECH TIP: How To Create Graphics in Excel
You can create many types of graphics discussed in this chapter using a spreadsheet program such as Microsoft Excel. First you enter the data that the graphic will display; then you select the type of graphic to create.
After creating a graphic, you can use the Copy and Paste commands to insert your graphic in your document.
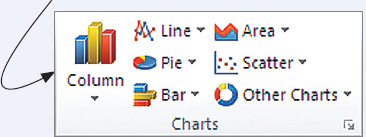
1. After you have entered your data in a spreadsheet, select the type of graphic by using the drop-
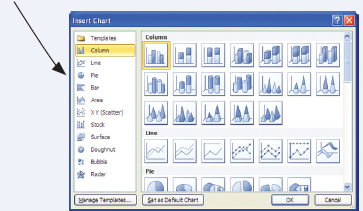
You can also select the Chart dialog box launcher in the Charts group and then select the type of graphic using the Insert Chart dialog box.
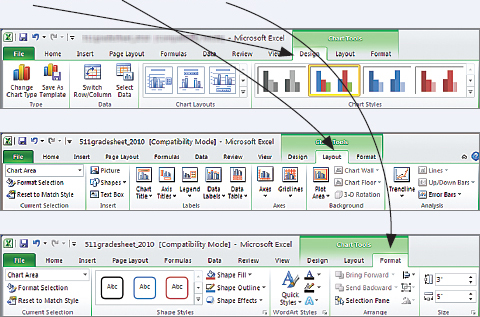
2. After you have created your graphic, you can modify the data range included and add or modify elements such as a title, labels, a legend, and grid lines by using the Design, Layout, and Format tabs.
KEYWORDS: chart wizard, chart type, data series, data range, data labels, legends