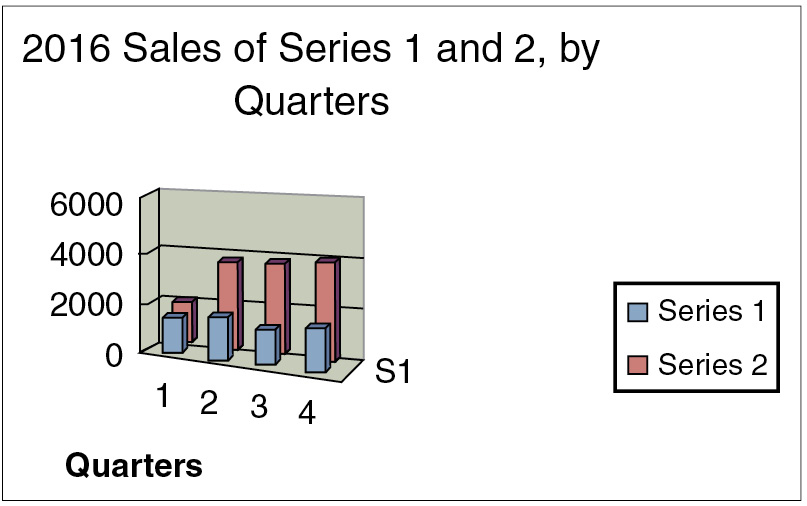
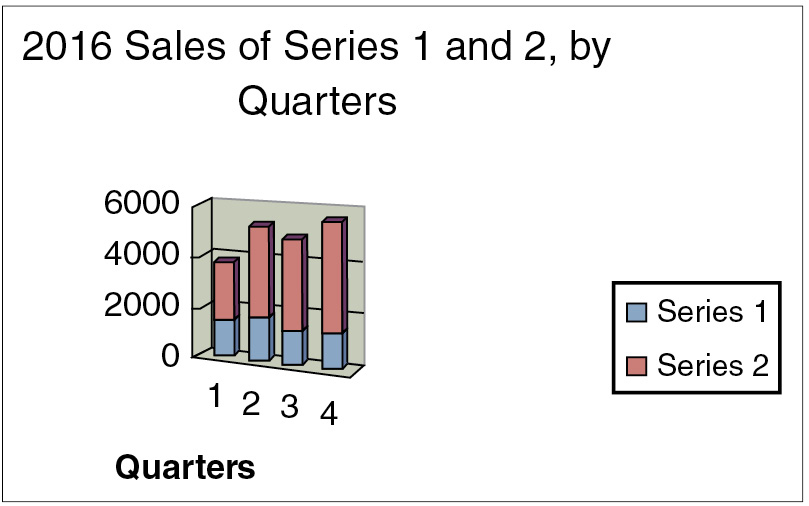
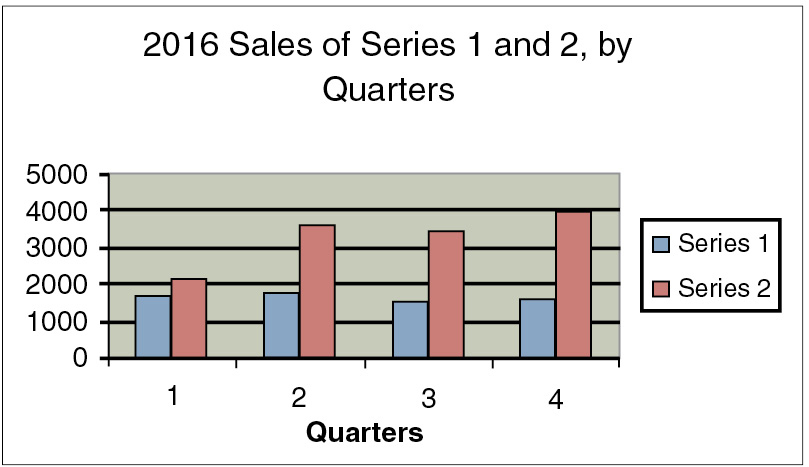
5. The following three graphs illustrate the sales of two products—Series 1 and Series 2—for each quarter of 2016. Which is the most effective in conveying the information? Which is the least effective? What additional information would make the most-effective graph better?