Chapter 13. Population Genetics
Objectives
By the end of the period, students will be able to:
- understand how gene frequencies and allele frequencies are calculated.
- understand Hardy-Weinberg equilibrium.
- understand what forces can move a population from equilibrium.
- demonstrate how predation can be a selective force in evolution.
- demonstrate the importance of camouflage as an adaptation to withstand predation.
- demonstrate genetic drift as an evolutionary process.
Introduction
For the last several labs, we have been looking at genetics from the perspective of an individual: how genes are inherited and expressed, how an individual may get a particular genotype, and even how to examine the DNA of an individual. It is equally important (but in a different way) to understand the genetics of a population. To a biologist, a population is a group of interbreeding individuals of the same species.
To examine genetics at the population level, we talk about frequencies of different alleles. That is, what proportion of a population has a particular allele? Although a diploid individual will have two alleles (2 copies of a gene, one from each parent), in a population, there may be more than two alleles. Also, in populations as with individuals, it is important to remember the difference between phenotype and genotype.
How to Calculate Allele Frequencies
The frequency of an allele is the percent of that particular allele in the population. For example, if we have a population of 7 individuals of AA genotype, 6 individuals of Aa genotype, and 2 individuals of aa genotype, then:
the AA individuals contain a total of 14 A alleles,
the Aa individuals contain 6 A alleles and 6 a alleles, and
the aa individuals contain a total of 4 a alleles.
(There are a total of 15 individuals in the population and a total of 30 alleles.)
Therefore, we have a total of 20 A alleles and 10 a alleles. Because there are 30 alleles (total) in the population (adding up the A and the a alleles) we can calculate the percent or frequency of, for example, allele A in this population as:
Frequency of allele A
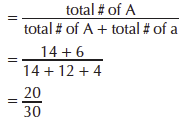
So, in this example, the frequency of allele A is 0.67 (20 divided by 30).
Similarly, the frequency of allele a is 0.33 (10 divided by 30). In this way, the frequency of any allele in the population can be calculated.
We can also calculate the frequencies of different phenotypes. Remember that phenotype is the expression of the genes and thus occurs in individuals. In the above example, we will assume A is dominant over a.
The frequency of the A phenotype
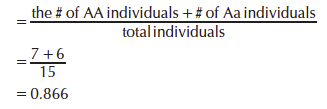
The frequency of the a phenotype is 2/15.
The Hardy-Weinberg Principle
Discovered independently by G.E. Hardy and W. Weinberg, the principle that bears their name states: “In large, randomly mating populations of diploid individuals and in the absence of mutation, migration or natural selection, the genotypic proportions of a population tend to remain constant.” This principle is a powerful tool for understanding how allele frequencies change (or don’t change) over time, and what forces are important in changing gene frequencies.
If you know the allele frequencies for a population right now, how can you calculate the allele frequencies that will be found in the next generation? We do this in a way that is similar to a Punnett square.
Let’s assume we have a population with the following allele frequencies:
We will set p = frequency of A = 0.7
We will set q = frequency of a = 0.3
First note that p + q = 1.
If we assume random mating and no mutation, immigration, or selection, we can set up the following method for calculating the next generation:
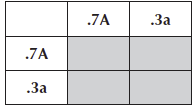
The shaded boxes represent the next generation, and by cross-multiplying, we can learn the genotypic frequencies for the next generation:
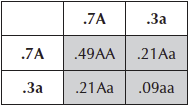
So the genotype frequencies in the second generation are:
0.49 AA
0.42 Aa
.09 aa
Note that (0.49 + 0.42 + 0.09 = 1).
To calculate the allele frequencies we can change from proportions to numbers and say this population has 100 individuals. If there are 100 individuals there are 200 alleles.
The frequency of the A allele is:
(49 + 49 + 42)/200 = 140/200 = 0.7
The frequency of the a allele is:
(42 + 9 + 9)/200 = 60/200 = 0.3
Note that these proportions are the same as what we started with! Note that the domimant allele will not increase in time if the assumptions of the Hardy-Weinberg equilibrium are met.
How can you tell if a given population is in equilibrium?
What causes evolution?
Departures from the Hardy-Weinberg Equilibrium
Some members of a population may have adaptations that allow them to be more successful than other members of the population in surviving and producing viable offspring. When the alleles conferring these advantages are inherited by succeeding generations, those advantageous traits will become increasingly more prevalent in the population over time. Natural selection results when individuals possessing traits that allow greater survival and/or reproduction leave more offspring. If the individual variations are heritable (passed on from one generation to the next), the offspring will possess those same beneficial traits. Eventually the population will be dominated by individuals with these traits and the genetic composition of the population will have changed. At the genetic level, evolution is a change in the proportion of different alleles possessed by a population. Evolution occurs only within populations (not within individuals; individuals live and die, but by themselves do not evolve), as the genetic composition of the population changes over time.
What determines whether an adaptation is advantageous? In one environment a certain characteristic may be advantageous but in another environment the same characteristic may confer no advantage or even be disadvantageous. So it is the environment that sorts through or selects between various adaptations (alleles) of a population and that ultimately determines which of the individuals in a population will survive and leave the most progeny.
Predation may act as a powerful environmental factor (or selective force) in determining which members of a prey population are more likely to survive and eventually increase in number. In the same way, the characteristics of a prey population determine which of the predators are likely to survive. For example, only swift predators will be able to catch swift prey. Prey and predator influences on each other are ongoing dynamic processes that may produce slow shifts or changes over time in the alleles possessed by the respective populations (i.e., evolution).
Another way, besides natural selection, that the genetic composition of a population may change is by genetic drift. Genetic drift is defined as random changes in the genetic composition of a population. Genetic drift is particularly important in small populations.
The purpose of this week’s lab is for you to become familiar with how natural selection and genetic drift can lead to a change in the frequency of phenotypes in a population in only a few generations.
Exercise 1. Natural Selection in a Predator-Prey System
In this exercise we will simulate the process of evolution by natural selection. This simulation demonstrates how the genotypic and phenotypic composition of a prey population, when subjected to natural selection in the form of predation, can change over time (that is, with each generation) to produce a population adapted for survival in a certain habitat with a given set of predators.
DIRECTIONS
The population is composed of organisms represented by individual beans. Within this population there is a substantial amount of phenotypic variation, with individuals of five colors. Different groups in the lab will examine the process of natural selection as it occurs in different “habitats.” The “habitat” the population lives in is represented by a piece of cloth. The habitat may be complex in pattern or shading or structure, or the habitat may be simple in appearance and structure.
You will act as a large predator, picking off individuals of this multicolored prey population. Those individuals in the prey population that survive your predation will reproduce asexually, passing all their genes on to the next generation. Asexual reproduction is common in bacteria, protists, fungi, many plants, and even some animals. We will record how the genotype and the phenotype of the prey population change over time (evolution) as a result of natural selection by predators.
- Work in groups of 4 for this simulation.
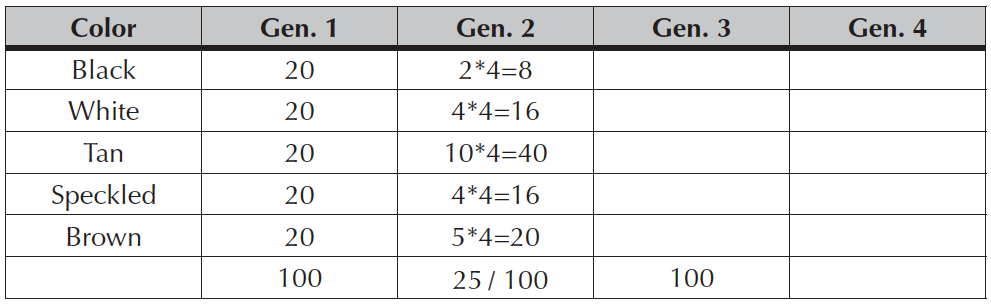
- Create a “prey population” of a total of 100 individuals by getting 20 beans of 5 colors from the side table. Record the population composition in Table 13-1 in the Hand-In. Put the colors of the prey population under “Color” and the number of each color prey (should be 20 at this point) under the column heading “Generation 1” in Table 13-1.
- One person of the team (the “Disperser”) will control dispersal of the “prey” in the “habitat space” (cloth) each “generation” (round). The other 3 players are “predators.” Each generation, the predators will “eat” exactly 25 prey so that a total of 75 individuals is eaten each generation.
- These predators function only at night so turn the room light off. Predators should close their eyes while the Disperser spreads out the prey across the habitat. The Disperser should take care to spread out any clumps of prey but not intentionally hide any of the prey.
- At a sign from the Disperser that dispersal is complete, the predators may begin “hunting.” Predators may detect prey by sight only. They may pick up prey from any part of the habitat but only one prey item at a time. This behavior mimics natural predators, which usually eat only one prey item at a time. Place captured prey in a separate cup. You predators are hungry and should work as quickly as possible but each predator should stop when he/she has eaten 25 prey.
- Collect the 25 surviving prey after all predators have eaten their quotas. Arrange the survivors according to color, and count the number of each phenotype that survived. Record this number in table 13-1.
- Take the number of survivors and multiply by 4 for the new total of individuals into the next generation. Record this in table 13-1. Add the number of beans to the cup for the new population because, each surviving prey individual reproduces asexually to produce 3 identical offspring (same color as parent) for the next generation. So, for each survivor, add 3 beans of the same color to the population. The offspring plus their surviving parents now make a new population of 100 prey individuals. Record the new population composition in the data table (Generation 2).
- The Disperser should put the new population in a cup and shake to mix well. Repeat steps 4–7 three more times recording the population composition at the beginning of each new generation.
An example of how to calculate the next generation is shown below:
Exercise 2. Genetic Drift Simulation
The genetic composition of a population can be described in terms of the frequency (or proportion) of all alleles possessed by that population. Evolution occurs by any process that results in a heritable (can be inherited) change in allele frequencies within a population. Natural selection, as we simulated in Exercise 1, is one of the most important mechanisms of evolutionary change. The basis of natural selection is that those individuals in a population that are best suited (adapted) for survival and reproduction in a particular environment will leave more offspring than other individuals. As a result, the genetic composition of the population can change (evolve) over time to more and more resemble those individuals who are reproducing most often. Another way that the genetic composition of a population can change is by randomor chance events. As opposed to natural selection, a random event acts unselectively on a population. Individuals are affected by random events in ways that have nothing to do with their particular genotype or phenotype. Any change in the allele frequencies of a population due to random events is called genetic drift.
Let’s consider an example of genetic drift. Suppose a population of butterflies is devastated by an earthquake or storm or other event that kills individuals without regard to their phenotype. If the individuals that survive these disturbances have a different proportion of alleles than the original population, then the population has changed in its genetic composition. If the population has changed genetically, offspring of the survivors will also have a different genetic composition than the original predisturbance population. Thus, evolution has occurred, but has adaptation? Although genetic drift is a mechanism of evolution, it is not a mechanism of adaptation. Why? Because those individuals that die or survive do so by chance alone, without regard to any aspect of their phenotype. Thus, although the genetic composition of the population may have changed (evolved), it cannot be predicted that the population is any more or less or differently adapted to the environment than it was before the event.
Genetic drift is a much more important mechanism of evolution in small populations than in larger populations. Why? Because the loss of a few individuals in a small population is much more likely to alter the genetic structure of the population than the loss of a few individuals from a larger population. In other words, small populations are much more subject to geneticchange due to chance events than are large populations.
It is not uncommon in nature for a population (large or small) to become greatly reduced in size, a situation referred to as a population bottleneck. Whenever a population is reduced in size, there is the chance that alleles may be lost from the population or, at the very least, that the allele frequencies of the population will be altered. A population bottleneck may be caused by natural selection (acts on individuals according to their phenotype) or genetic drift (nonselectively). In this exercise we will examine a situation in which a population has been reduced by genetic drift. As in any change in the genetic structure of a population by genetic drift, it will be purely a matter of chance which individuals survive or die. Beads of two different colors will represent two possible alleles for a particular gene in an original population of 60 individuals. Populations of different sizes will be randomly removed from the original population. The beads that are removed from the original population represent a “bottleneck” population. Our research question is:
Does the severity of a population bottleneck caused by genetic drift affect the degree to which the new population varies genetically from the original population, in other words, the degree to which genetic drift has occurred?
PROCEDURE
- In this exercise, we will use pop beads to represent two different alleles for coat color in a population of chipmunks. We will assume that fur color is a simple genetic trait coded for by a single gene pair. We will arbitrarily define red as B and yellow as b. A pair of beads represents a chipmunk with a particular diploid genotype for coat color.
- Obtain 20 pairs of alleles representing each of the following:
- Chipmunks that are homozygous for the dominant allele for coat color.
- Chipmunks that are heterozygous for the coat color allele.
- Chipmunks that are homozygous for the recessive allele for coat color.
- Place the 60 “chipmunks” into a bag. These chipmunks represent the population that will experience genetic drift. What are the allele frequencies of B and b in this original population?
Allele frequency of B ________ Allele frequency of b ________
- Now we will simulate changes in the allele frequencies in the chipmunk population due to an event that can lead to genetic drift such as migration or death of a random portion of the population. Each of the simulations that follow represents a different level in the severity of a population bottleneck.
- Without looking at the beads, one person removes 30 chipmunks. These 30 chipmunks represent the survivors of a moderately severe population bottleneck. Record the number of individuals of each genotype in Table 13-2.
- Place the beads you removed back in the bag to restore the population to 60 chipmunks. Repeat the simulation removing 20 chipmunks, then 10 chipmunks, and finally 5 chipmunks. Remember to place all the beads back into the bag before you begin each new simulation. For each simulation, record the number of individuals of each genotype in Table that you create on the Hand-In.
- Next, record your data for the number of alleles possessed by each of the four bottleneck populations. Then, calculate the proportion of each kind of allele possessed by each population. To calculate proportions, multiply the frequencies of each allele in the population by 100.
- Record the results of the rest of the class.