Interactive Exercise
A Theoretical Model of the Sun
Chapter 1. A Theoretical Model of the Sun
1.1 A Theoretical Model of the Sun
Interactive Exercise

Question 1 of 4
A Theoretical Model of the Sun
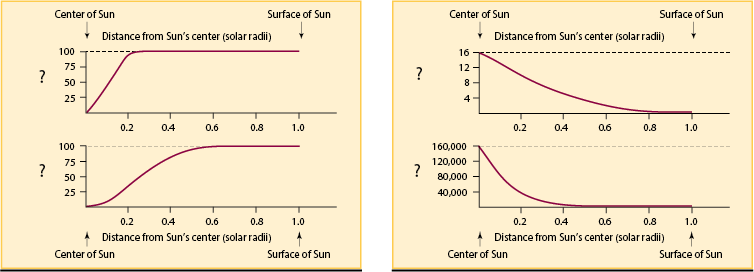
Click on the Luminosity (%) graph axis in the image below.
{"title":"Luminosity graph axis","description":"","type":"correct","color":"#999999","code":"[{\"shape\":\"rect\",\"coords\":\"24,36,94,120\"}]"} {"title":"Density graph axis","description":"Incorrect. Try again.","type":"incorrect","color":"#999999","code":"[{\"shape\":\"rect\",\"coords\":\"408,138,489,217\"}]"} {"title":"Temperature graph axis","description":"Incorrect. Try again.","type":"incorrect","color":"#999999","code":"[{\"shape\":\"rect\",\"coords\":\"406,45,489,117\"}]"} {"title":"Mass graph axis","description":"Incorrect. Try again.","type":"incorrect","color":"#999999","code":"[{\"shape\":\"rect\",\"coords\":\"25,137,99,215\"}]"}Click on the Density (kg/m3) graph axis in the image below.
{"title":"Luminosity graph axis","description":"Incorrect. Try again.","type":"incorrect","color":"#999999","code":"[{\"shape\":\"rect\",\"coords\":\"24,36,94,120\"}]"} {"title":"Density graph axis","description":"","type":"correct","color":"#999999","code":"[{\"shape\":\"rect\",\"coords\":\"408,138,489,217\"}]"} {"title":"Temperature graph axis","description":"Incorrect. Try again.","type":"incorrect","color":"#999999","code":"[{\"shape\":\"rect\",\"coords\":\"406,45,489,117\"}]"} {"title":"Mass graph axis","description":"Incorrect. Try again.","type":"incorrect","color":"#999999","code":"[{\"shape\":\"rect\",\"coords\":\"25,137,99,215\"}]"}Click on the Temperature (106K) graph axis in the image below.
{"title":"Luminosity graph axis","description":"Incorrect. Try again.","type":"incorrect","color":"#999999","code":"[{\"shape\":\"rect\",\"coords\":\"24,36,94,120\"}]"} {"title":"Density graph axis","description":"Incorrect. Try again.","type":"incorrect","color":"#999999","code":"[{\"shape\":\"rect\",\"coords\":\"408,138,489,217\"}]"} {"title":"Temperature graph axis","description":"","type":"correct","color":"#999999","code":"[{\"shape\":\"rect\",\"coords\":\"406,45,489,117\"}]"} {"title":"Mass graph axis","description":"Incorrect. Try again.","type":"incorrect","color":"#999999","code":"[{\"shape\":\"rect\",\"coords\":\"25,137,99,215\"}]"}Click on the Mass (%) graph axis in the image below.
{"title":"Luminosity graph axis","description":"Incorrect. Try again.","type":"incorrect","color":"#999999","code":"[{\"shape\":\"rect\",\"coords\":\"24,36,94,120\"}]"} {"title":"Density graph axis","description":"Incorrect. Try again.","type":"incorrect","color":"#999999","code":"[{\"shape\":\"rect\",\"coords\":\"408,138,489,217\"}]"} {"title":"Temperature graph axis","description":"Incorrect. Try again.","type":"incorrect","color":"#999999","code":"[{\"shape\":\"rect\",\"coords\":\"406,45,489,117\"}]"} {"title":"Mass graph axis","description":"","type":"correct","color":"#999999","code":"[{\"shape\":\"rect\",\"coords\":\"25,137,99,215\"}]"}Activity results are being submitted...
