To advance to the next page of the tutorial you need to submit every question; currently you have not finished all the questions on this page. Leaving a tutorial page without submitting all the questions results in you receiving no grade in the gradebook.
true
Author: Beth Hufnagel, Anne Arundel Community College
Editor: Grace L. Deming, University Of Maryland
The goals of this module: After completing this exercise, you should be able to:
Recognize that an object's temperature and density can be inferred from the amount and type of light it emits.
Use Wien's Law to quantify how hotter, dense objects (such as stars) emit more short wavelength light than cooler, dense objects (such as planets).
Use the Stefan-Boltzmann Law to quantify that hotter dense objects emit more energy per square meter of surface area per second than cooler dense objects.
Infer the density and temperature of an object from its spectrum.
In this module you will explore:
How an object's temperature affects the light it emits and absorbs.
How an object's density affects the light it emits and absorbs.
Why you are doing it: By understanding that an object's temperature can be revealed by studying the light that it emits, you can learn how astronomers are able to determine the temperature of distant celestial objects, whether hot or cold. In addition, the light coming from distant objects gives clues to the density of the material emitting or absorbing the light.
5.2Background
The simplest and most common way to produce light, either on or off the Earth, is to heat material. Use this animation to explore what happens when electrical energy is added to a neon light bulb. Add neon to the tube, then see what happens when you change the temperature dial. The horizontal axis of the spectrum is in nanometers (nm). Clear the spectrum and Open the periodic table to add a different element. Are the elements the same or does each have a unique pattern?
Question Sequence
Question
1.
As the temperature increases, what happens to the spectrum on the screen?
A.
B.
C.
D.
3
Try it again with the simplest element, hydrogen (H)!
Correct. Each element has it's own "fingerprint" of lines, and as it gets hotter, the same lines just get more intense. (However, the lines for ions of an element are different than that same element when it is an atom and has all of its electrons.) This is formally described as Kirchhoff's Second Law: A hot, transparent gas produces an emission line spectrum - a series of bright spectral lines against a dark background.
Incorrect. Each element has it's own "fingerprint" of lines, and as it gets hotter, the same lines just get more intense. (However, the lines for ions of an element are different than that same element when it is an atom and has all of its electrons.) This is formally described as Kirchhoff's Second Law: A hot, transparent gas produces an emission line spectrum - a series of bright spectral lines against a dark background.
Question
2.
Go back to the spectrum of neon (Ne) alone. When you now add helium (He), lines of which new color appear?
A.
B.
C.
D.
3
Clear the screen and try it again.
Correct. A violet line to the left of the primarily yellow and red lines of neon now appear, coming from the helium lamp. When you look at each bulb, not only is the light of each element unique, but the pattern of the lines when the light is split into a spectrum are also unique.
Incorrect. A violet line to the left of the primarily yellow and red lines of neon now appear, coming from the helium lamp. When you look at each bulb, not only is the light of each element unique, but the pattern of the lines when the light is split into a spectrum are also unique.
Question
3.
Now create a spectrum where you have added together all of the elements, without clearing the screen between the different elements, as if they are all densely crowded together in a bulb at one time. If the emission lines for all 116 elements known were added together, what adjective would best describe the resulting spectrum?
A.
B.
C.
D.
3
Try adding some more elements without clearing the screen.
Correct. The lines start filling in the gaps and overlapping to form a continuous spectrum. So, the light from hot, dense objects moves smoothly and continuously from one wavelength to another, although the intensity of each wavelength is different. This is called Kirchoff's first law. In the next section, we'll explore the characteristic spectra of hot, dense objects.
Incorrect. The lines start filling in the gaps and overlapping to form a continuous spectrum. So, the light from hot, dense objects moves smoothly and continuously from one wavelength to another, although the intensity of each wavelength is different. This is called Kirchoff's first law. In the next section, we'll explore the characteristic spectra of hot, dense objects.
5.3Kirchoff's Second Law
So far, spectra have been represented as a bar of visible light. The color is on the horizontal axis, with the red to the right and blue to the left. Intensity has been represented by how bright the color is. Spectra produced from modern digital cameras also have the colors on the horizontal axis, but labeled with their wavelength in nanometers. The intensity is shown by the height of the vertical axis. The emission spectrum of neon would transform as shown below. Click on several elements in the periodic table and take a look at their spectra as well.
Question
4.
How could you identify neon by its spectrum alone?
A.
B.
C.
D.
3
You may want to go back to the previous animation and play with some of the simpler elements again.
Correct.
Incorrect.
5.4Wien's Law and the Stefan-Boltzmann Law
The color of light radiated by the Sun, other stars, and planets is also dependent on their temperature because the intensity of each line changes as the temperature increases.
These celestial objects are also so dense that you can't see through them, and light is trapped inside them and can only escape at the surface. The continuous spectrum that results is described by Kirchhoff's First Law: A hot, opaque body such as a hot, dense gas produces a continuous spectrum - a complete rainbow of colors without any spectral lines.
This also means that the light that does get out can be modeled by two equations, Wien's law and the Stefan-Boltzmann law.
Use this animation to explore how changing the temperature changes the color and intensity of the light.
This is quantified in Wien's law, λmax=0.0029•K•mT
Question Sequence
Question
5.
Notice that there is a maximum wavelength, the wavelength at which the intensity is at its greatest. What is the maximum wavelength when the object is at 300 Kelvin?
A.
B.
C.
D.
3
Try again. Try typing in 300 for the temperature and click to look at that curve.
Correct. The wavelength is an extremely long (for light!) 10,000.
Incorrect. The wavelength is an extremely long (for light!) 10,000.
Question
6.
What is the trend in maximum wavelength as an object's temperature increases?
A.
B.
C.
3
Try again. Try continuously changing the temperature by holding down on the black arrow.
Correct. As the temperature increases, the maximum wavelength gets shorter and more energetic. Notice that there is a limit ; the wavelength can't be zero. This is described by Wien's law, where the maximum wavelength (λ max) is equal to 2.9 million nanometers divided by the temperature (T) in Kelvin, or λ max = 2.9×10⁶ K nm / T.
Incorrect. As the temperature increases, the maximum wavelength gets shorter and more energetic. Notice that there is a limit ; the wavelength can't be zero. This is described by Wien's law, where the maximum wavelength (λ max) is equal to 2.9 million nanometers divided by the temperature (T) in Kelvin, or λ max = 2.9×10⁶ K nm / T
Question
7.
At what wavelength (in nanometers) would you expect a planet like Upsilon Andromedae B with a temperature of 1500 K to peak?
A.
B.
C.
Correct. This is in the infrared, which is why the Spitzer Infrared telescope, orbiting above Earth's atmosphere, is used to study planets like this.
Incorrect. This is in the infrared, which is why the Spitzer Infrared telescope, orbiting above Earth's atmosphere, is used to study planets like this.
Question
8.
The total energy given off by an object can be estimated as the area under the curve. This is described by the Stefan-Boltzmann law, where the energy flowing out of a square meter per second on the surface of the object is called the flux (F) and is proportional to the temperature raised to the fourth power, or F = σT 4 . The constant sigma (σ) is always equal to 5.67 x 10 -8 Watts per square meter per K 4. Assume that the object stays the same size.
A 6000K object gives off ____________ times the energy a 3000K object gives off.
A.
B.
C.
D.
Correct. The 6000K object gives off about 16 times as much energy!
Incorrect. The 6000K object gives off about 16 times as much energy!
Question
9.
How much flux does Venus, with a surface temperature of 700 K, give off? ____________Watts
A.
B.
C.
D.
Correct. We multiply 700 by itself four times, then multiply the answer by the constant sigma to get 13,600 Watts per second per square meter. And yes, these are the same Watts you use to measure the power of a light bulb! It's also about 14 kiloWatts, a unit you can find on your electric bill.
Incorrect. We multiply 700 by itself four times, then multiply the answer by the constant sigma to get 13,600 Watts per second per square meter. And yes, these are the same Watts you use to measure the power of a light bulb! It's also about 14 kiloWatts, a unit you can find on your electric bill.
Question
10.
Which adjective best describes these curves?
A.
B.
C.
D.
3
Try again. Notice how smooth the curve is.
Correct. There are no gaps in these curves. So, the light from hot, dense objects moves smoothly and continuously from one wavelength to another, although the intensity of the wavelength is different. This is called Kirchoff's first law. In the next section, we'll see what happens when continuous and emission spectra are combined.
Incorrect. There are no gaps in these curves. So, the light from hot, dense objects moves smoothly and continuously from one wavelength to another, although the intensity of the wavelength is different. This is called Kirchoff's first law. In the next section, we'll see what happens when continuous and emission spectra are combined.
5.5Kirchoff's Third Law
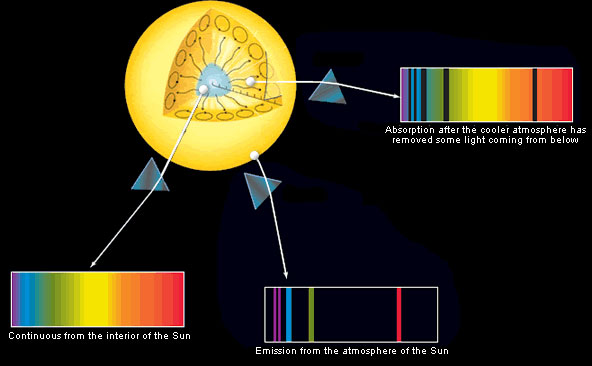
Stars are the only celestial objects that are described well by Kirchoff's first law. However, most stars also have a cooler, thinner atmosphere (called the photosphere) through which the light from the star must pass to get out and radiate away into space. Since that layer is cooler than the underlying layer (but still hot at 5800K!), the photosphere absorbs selected colors of light rather than emitting them. The resulting 'dark-line' or absorption spectrum is described by Kirchoff's third Law, which says that a cool, transparent gas in front of a source of a continuous spectrum produces an absorption line spectrum-a series of dark spectral lines among the colors of the continous spectrum. Furthermore, the dark lines in the absorption spectrum of a particular gas occur at exactly the same wavelengths as the bright lines in the emission spectrum of that same cool gas.
Question Sequence
Question
11.
What does the spectra coming from the interior of the Sun tell us about the conditions there, compared to the Sun's atmosphere?
A.
B.
C.
D.
3
Try again.
Correct.
Incorrect.
Question
12.
How would the spectrum change if the cooler gas were more distant from the Sun, but still in between the telescope and the Sun?
A.
B.
C.
D.
3
Try again. In both cases, you have light from a hot, dense object going through a cooler gas. What would make the spectra different from each other?
Correct. As long as the cloud of gas and the star are moving the same way, the spectrum would look much the same.
Incorrect. As long as the cloud of gas and the star are moving the same way, the spectrum would look much the same.
5.6Review of Kirchoff's Laws
Thin clouds of gas and dust described by Kirchoff's second law occupy the space between the stars, but have also been observed between galaxies. When we look at even the closest stars, there are thin clouds of interstellar gas and dust between us and the other star. Most of the time these clouds are cooler than the star, meaning that the light that arrives at our telescopes includes dark lines from both the star's atmosphere and from the gas and dust clouds. The cooler material absorbs some of the light from the star. The resulting spectrum is also described by Kirchoff's third law.
Question Sequence
Question
13.
Can you label the spectra properly?
Table
Correct.
Incorrect.
5.7Quick Check Quiz
Indepth Activity: Spectra and Kirchhoff's Laws
Question
14.
Each chemical element produces:
A.
B.
C.
D.
E.
Correct. The unique electron structure of each element results in a unique spectrum.
Incorrect. The unique electron structure of each element results in a unique spectrum.
Question
15.
A hot dense gas produces:
A.
B.
C.
D.
E.
Correct. A hot dense gas, like a hot solid, gives off a continuous spectrum.
Incorrect. A hot dense gas, like a hot solid, gives off a continuous spectrum.
Question
16.
Red stars are:
A.
B.
C.
D.
E.
Correct. As any object gets hotter, its peak wavelength shifts toward the blue.
Incorrect. As any object gets hotter, its peak wavelength shifts toward the blue.
Question
17.
Some stars have no atmosphere. Light emerging from such a star’s surface would:
A.
B.
C.
D.
E.
Correct.
Incorrect.
Question
18.
Comparing the spectra for a blue star and a red star of equal size, the blue star
A.
B.
C.
Correct. A blue star has a higher temperature, and so produces much more energy, as described by the Stefan-Boltzmann law F = σT4.
Incorrect. A blue star has a higher temperature, and so produces much more energy, as described by the Stefan-Boltzmann law F = σT4.
Question
19.
In the emission spectrum for sodium, two bright yellow lines are visible. As the temperature of the sodium increases, these lines
A.
B.
C.
Correct. You observed the emission lines increasing in intensity in the first 'Background' animation.
Incorrect. You observed the emission lines increasing in intensity in the first 'Background' animation.
Question
20.
The average temperature of Mars is lower than that of Venus. If an observer measures the spectrum of infrared radiation coming from each planet, what would she discover ?
A.
B.
C.
D.
Correct. Correct. The hotter object, Venus, would be most intense at shorter wavelengths, as described by Wien's law, λmax = 0.0029 K⋅m/T
Incorrect. You observed the emission lines increasing in intensity in the first 'Background' animation.
Question
21.
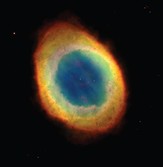
The image on the right shows the Ring Nebula. Which type of spectrum do you think the Nebula has?
A.
B.
C.
Correct. Correct. Thin, hot gas has an emission spectrum (Kirchhoff's second law).
Incorrect. Thin, hot gas has an emission spectrum (Kirchhoff's second law).
Question
22.
A star having a temperature of 3000K emits mostly:
A.
B.
C.
D.
Correct. Correct. This is a cooler star than the Sun, which is emitting mostly in the visible from a surface temperature of 5800 K.
Incorrect. This is a cooler star than the Sun, which is emitting mostly in the visible from a surface temperature of 5800 K.
Question
23.
The Sun's spectrum, as observed from Earth, is classified as
A.
B.
C.
Correct. Correct. Light from the Sun's continuous spectrum is absorbed first by the Sun's cooler atmosphere, and then again by the much cooler atmosphere of Earth.
Incorrect. Light from the Sun's continuous spectrum is absorbed first by the Sun's cooler atmosphere, and then again by the much cooler atmosphere of Earth.