Chapter 1. Light Curves and Spectra
Map Learning Exercises
Question 1 of 5
Light Curves and Spectra
Which curve result from the light emissions of a cloud of thin gas?
Click on the correct light curve to receive credit.
{"title":"selection","description":"The dips that you see in this curve, are a result of light shining through a cloud of gas, being ABSORBED by that gas at very specific wavelengths. These dips can be used to identify the elements contained in the cloud--- in this case: hydrogen.","type":"incorrect","color":"#ffffff","code":"[{\"shape\":\"rect\",\"coords\":\"19,8,252,150\"}]"} {"title":"Choice label","description":"The peaks that you see in this curve, are a result of the matter in the gas cloud becoming excited and then releasing that energy at very specific wavelengths. These peaks can be used to identify the elements contained in the cloud--- in this case: hydrogen.","type":"correct","color":"#ffffff","code":"[{\"shape\":\"rect\",\"coords\":\"317,9,549,150\"}]"}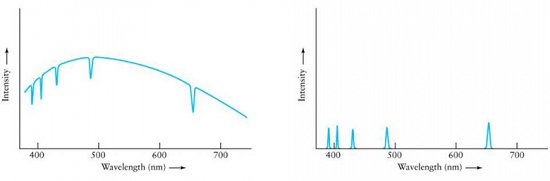
Correct.
Please try again.