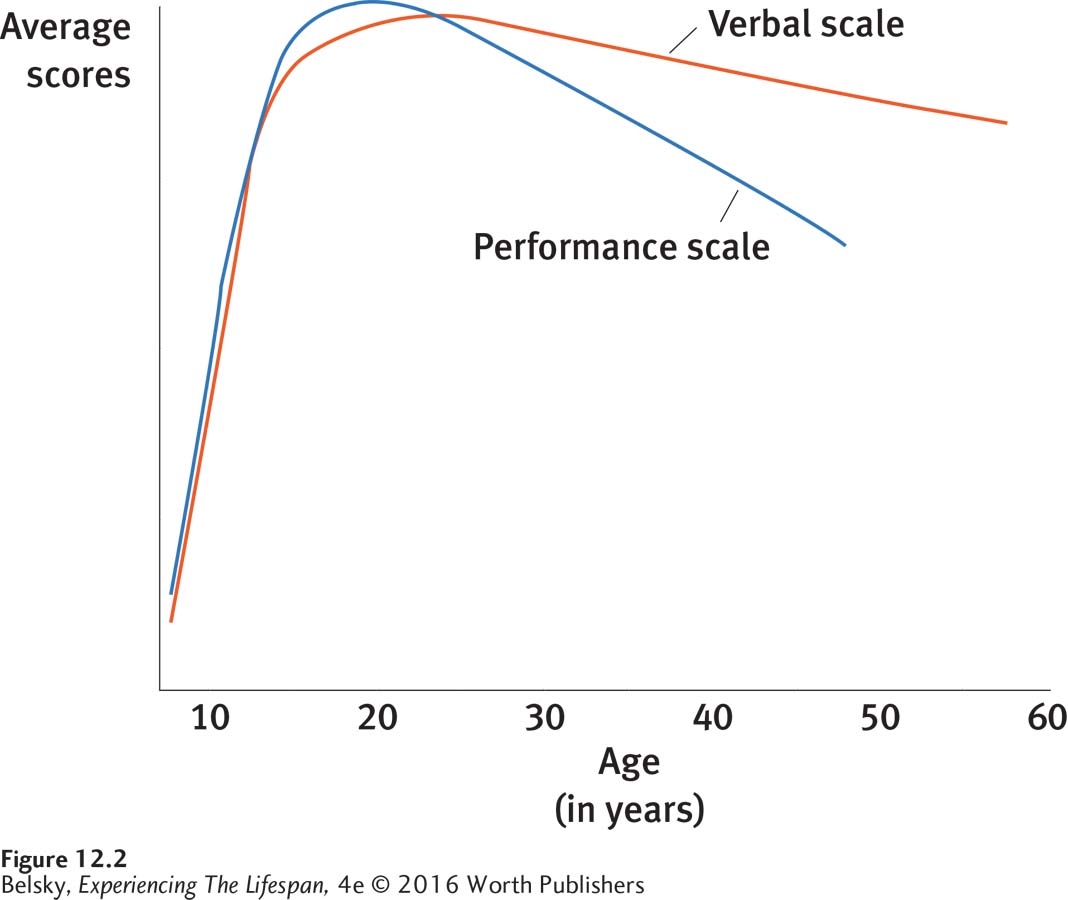
image
FIGURE 12.2: Age-related changes in mean scores on the performance and verbal scales of the WAIS: This chart showed the depressing pattern of decline from a study using the early form of the WAIS. Notice how average scores on the performance scale (items involving manipulating materials) regularly slid down starting in the twenties, while scores on the verbal scale remained more stable with age. Now compare this early age-decline with the data in figure 12.3.
Data from: Botwinick, 1967.