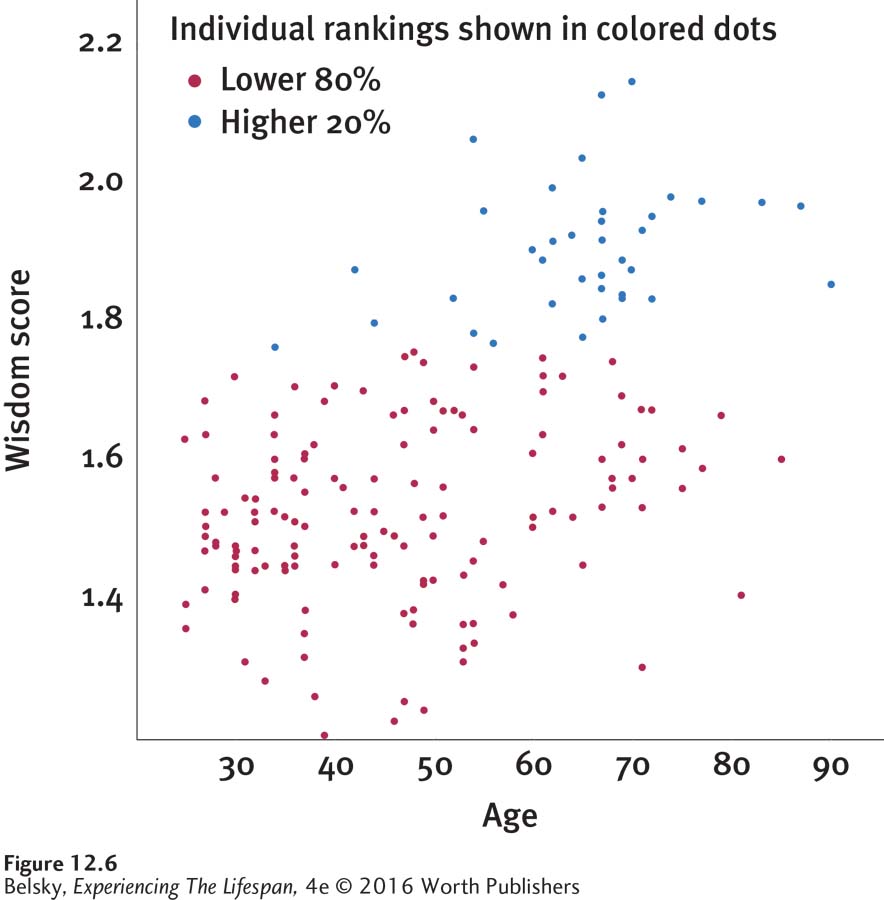
FIGURE 12.6: Age distribution of “wisdom” scores as judged by the way a random sample of Michigan adults of different ages reasons about scenarios involving ethnic and social conflicts: In this interesting study, notice that wisdom rates dramatically rise among the people in their sixties (blue dots), although about half of all elderly adults don’t make it into the wise category (red dots).
Data from: Grossmann and others, 2010, p. 7248.