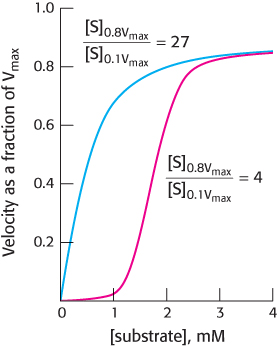
Allosteric enzymes display threshold effects.
As the
T-
t
o-
R transition occurs, the velocity increases over a narrower range of substrate concentration for an allosteric enzyme (red curve) than for a Michaeli
s–
Menten enzyme (blue curve).