FIGURE 17.7
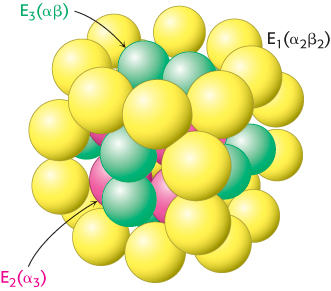
Schematic representation of the pyruvate dehydrogenase complex.
The transacetylase core (E
2
) is shown in red, the pyruvate dehydrogenase component (E
1
) in yellow, and the dihydrolipoyl dehydrogenase (E
3
) in green.
[
Leave
] [
Close
]
Next