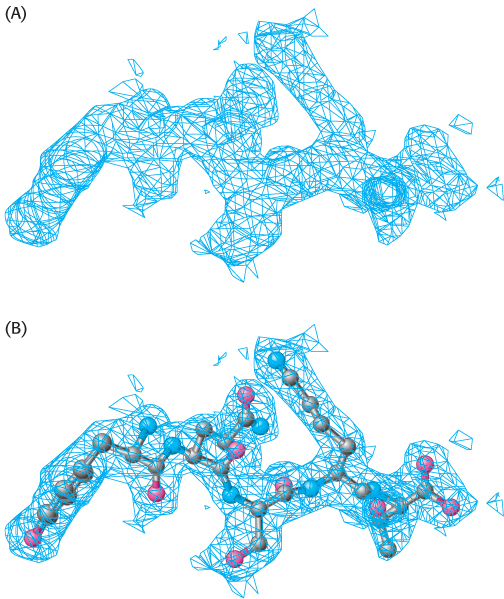
Interpretation of an electron-density map. (A) A segment of an electron-density map is drawn as a three-dimensional contour plot, in which the regions inside the “cage” represent the regions of highest electron density. (B) A model of the protein is built into this map so as to maximize the placement of atoms within this density.
[Drawn from 1FCH.pdb.]