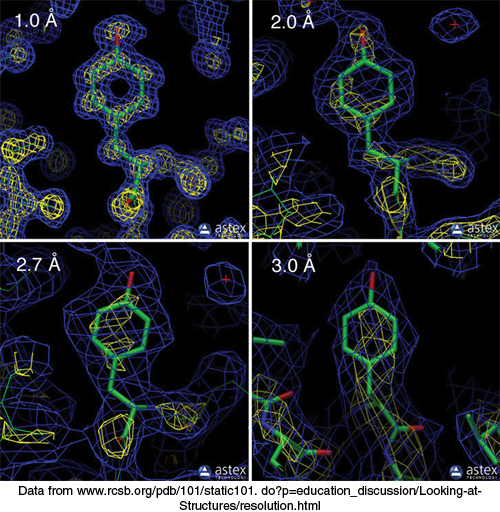
Resolution affects the quality of the electron density map. The electron density maps of a tyrosine residue at four different resolution levels (1.0 Å, 2.0 Å, 2.7 Å, and 3.0 Å) are shown. At the lower resolution levels (2.7 Å and 3.0 Å), only a group of atoms corresponding to the side chain is visible, whereas at the highest resolution (1.0 Å), individual atoms within the side chain are distinguishable.
[Data from www.rcsb.org/pdb/101/static101.do?p=education_discussion/Looking- t-