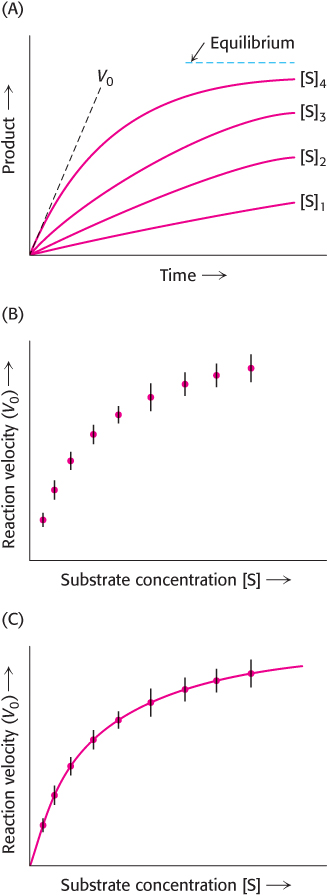
FIGURE 8.10 Determining the relation between initial velocity and substrate concentration. (A) The amount of product formed at different substrate concentrations is plotted as a function of time. The initial velocity (V0) for each substrate concentration is determined from the slope of the curve at the beginning of a reaction, when the reverse reaction is insignificant. (B) The values for initial velocity determined in part A are then plotted, with error bars, against substrate concentration. (C) The data points are connected to clearly reveal the relationship of initial velocity to substrate concentration.
[Leave] [Close]