APPENDIX: Binding Models Can Be Formulated in Quantitative Terms: The Hill Plot and the Concerted Model
APPENDIX: Binding Models Can Be Formulated in Quantitative Terms: The Hill Plot and the Concerted Model
The Hill Plot
A useful way of quantitatively describing cooperative binding processes such as that for hemoglobin was developed by Archibald Hill in 1913. Consider the hypothetical equilibrium for a protein X binding a ligand S:

where n is a variable that can take on both integral and fractional values. The parameter n is a measure of the degree of cooperativity in ligand binding. For X = hemoglobin and S = O2, the maximum value of n is 4. The value of n = 4 would apply if oxygen binding by hemoglobin were completely cooperative. If oxygen binding were completely noncooperative, then n would be 1.
Analysis of the equilibrium in equation 1 yields the following expression for the fractional saturation, Y:
where [S50] is the concentration at which X is half-
where P50 is the partial pressure of oxygen at which hemoglobin is half-

and so
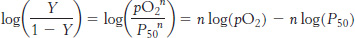
This equation predicts that a plot of log (Y/1 −Y) versus log(P50), called a Hill plot, should be linear with a slope of n.
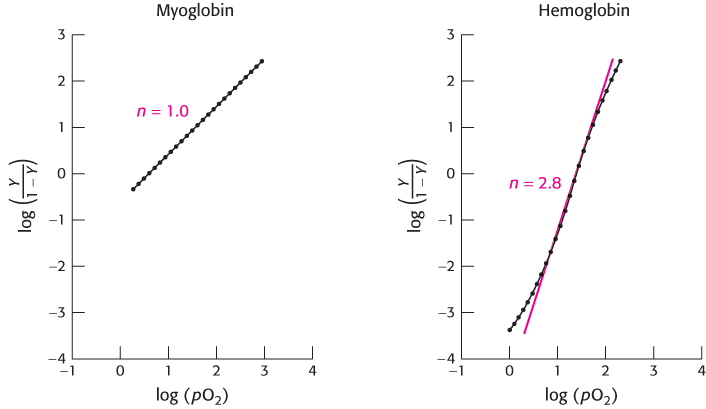
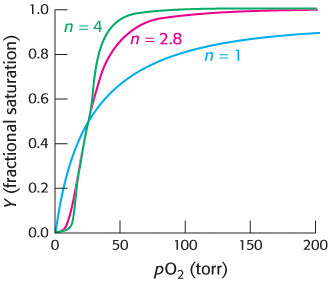
Hill plots for myoglobin and hemoglobin are shown in Figure 7.30. For myoglobin, the Hill plot is linear with a slope of 1. For hemoglobin, the Hill plot is not completely linear, because the equilibrium on which the Hill plot is based is not entirely correct. However, the plot is approximately linear in the center with a slope of 2.8. The slope, often referred to as the Hill coefficient, is a measure of the cooperativity of oxygen binding. The utility of the Hill plot is that it provides a simply derived quantitative assessment of the degree of cooperativity in binding. With the use of the Hill equation and the derived Hill coefficient, a binding curve that closely resembles that for hemoglobin is produced (Figure 7.31).
211
The Concerted Model
The concerted model can be formulated in quantitative terms. Only four parameters are required: (1) the number of binding sites (assumed to be equivalent) in the protein, (2) the ratio of the concentrations of the T and R states in the absence of bound ligands, (3) the affinity of sites in proteins in the R state for ligand binding, and (4) a measure of how much more tightly subunits in proteins in the R state bind ligands compared with subunits in the T state. The number of binding sites, n, is usually known from other information. For hemoglobin, n = 4. The ratio of the concentrations of the T and R states with no ligands bound, L, is the allosteric constant:
L = [T0]/[R0]
where the subscript refers to the number of ligands bound (in this case, zero). The affinity of subunits in the R state is defined by the dissociation constant for a ligand binding to a single site in the R state, KR. Similarly, the dissociation constant for a ligand binding to a single site in the T state is KT. We can define the ratio of these two dissociation constant as
c = KR/KT
This is the measure of how much more tightly a subunit for a protein in the R state binds a ligand compared with a subunit for a protein in the T state. Note that c < 1 because KR and KT are dissociation constants and tight binding corresponds to a small dissociation constant.
What is the ratio of the concentration of T-
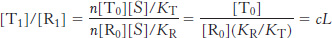
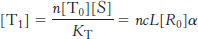
Similar analysis reveals that, for states with i ligands bound, [Ti]/[Ri] = ciL. In other words, the ratio of the concentrations of the T state to the R state is reduced by a factor of c for each ligand that binds.
Let us define a convenient scale for the concentration of S:
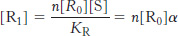
α = [S]/KR
This definition is useful because it is the ratio of the concentration of S to the dissociation constant that determines the extent of binding. Using this definition, we see that
Similarly,
What is the concentration of R-
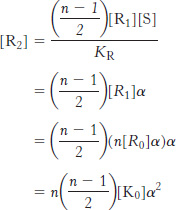
We can derive similar equations for the case with i ligands bound and for T states.
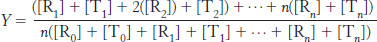
We can now calculate the fractional saturation, Y. This is the total concentration of sites with ligands bound divided by the total concentration of potential binding sites. Thus,
Substituting into this equation, we find
212
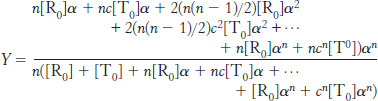
Substituting [T0] = L[R0] and summing these series yields
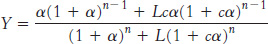
We can now use this equation to fit the observed data for hemoglobin by varying the parameters L, c, and KR (with n = 4). An excellent fit is obtained with L = 9000, c = 0.014, and KR = 2.5 torr (Figure 7.32).
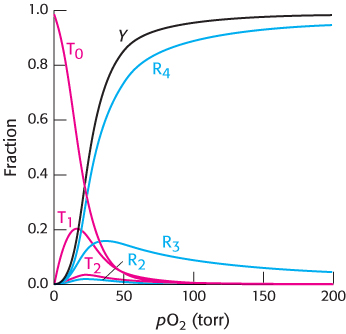
In addition to the fractional saturation, the concentrations of the species T0, T1, T2, R2, R3, and R4 are shown. The concentrations of all other species are very low. The addition of concentrations is a major difference between the analysis using the Hill equation and this analysis of the concerted model. The Hill equation gives only the fractional saturation, whereas the analysis of the concerted model yields concentrations for all species. In the present case, this analysis yields the expected ratio of T-
The sequential model can also be formulated in quantitative terms. However, the formulation entails many more parameters, and many different sets of parameters often yield similar fits to the experimental data.