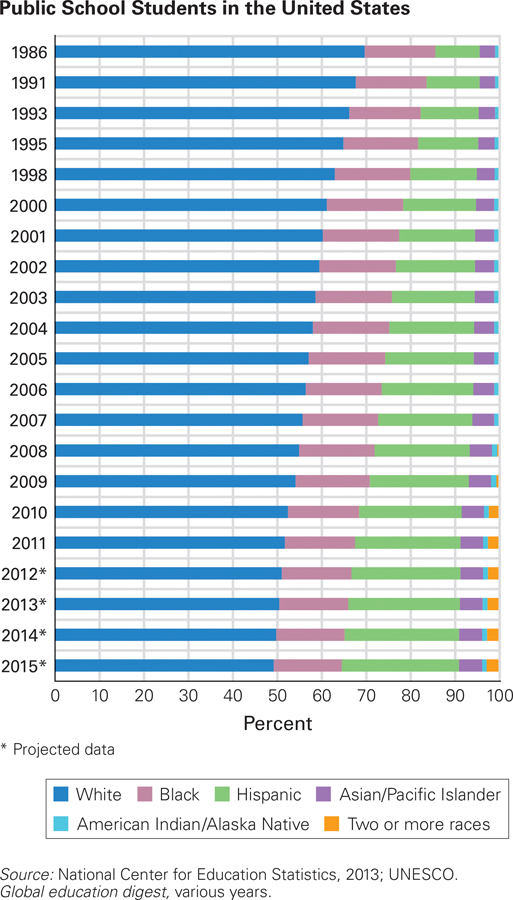
Opportunity Increasing As you know, each ethnic group measured by U.S. statistics is much more diverse than the broad categories shown here. On this chart, the “white” category may be particularly misleading, since children with heritage from Siberia, Baghdad, Dublin, and Oslo are all in that category, despite many religious and cultural differences among them. The two most numerous white categories are children of German or English heritage, but some of their ancestors arrived on the Mayflower and some by jet, with the largest wave coming by steerage between 1870 to 1930. Arrival date and circumstances affect each family. Nonetheless, crude as it is, this chart shows increasing intellectual opportunity: Cognitive growth occurs when people from diverse backgrounds listen to each other.
_________
As you remember from Chapter 1, “race” is a questionable category. In the United States, Hispanic people are of any race, but all are Latino with heritage from Mexico or farther south. Some of them speak only English and have lived in the United States for generations. The category “two or more races” was not offered until recently. Therefore it has not increased as much as it seems to have, since biracial students were considered to be of one race before 2008. This chart shows public school students only, but since 90 percent of U.S. students are in public schools, and since overt racial discrimination is illegal, the addition of private school students would not change the totals significantly.