Using the Scientific Method
There are hundreds of ways to design scientific studies and analyze results. Scientists are aware that no design is absolutely perfect, which is one reason researchers hope for replication of their studies and confirmation from other researchers who use a different design. In addition, statistics and calculations help scientists interpret their data. (Some statistical perspectives are presented in Table 1.2.)

Every research design, method, and statistical measure has strengths as well as weaknesses. It is impossible to describe them all here; there are so many that colleges offer year-
Observation

Video Activity: What’s Wrong with This Study explores some of the major pitfalls of the process of designing a research study.

Scientific observation requires researchers to record behavior systematically and objectively. Observations often occur in a naturalistic setting such as a home, where people behave normally. Scientific observation can also occur in a laboratory where scientists record human reactions in various situations, often with wall-
Observation is crucial to the development of hypotheses. However, observation provides issues to explore, not proof.
For example, one study of how long parents lingered when dropping off their children in preschool found that children were slower to engage with toys or friends when their parents stayed longer (Grady et al., 2012). This could mean that parental hesitancy to leave made children less social with friends. However, the opposite interpretation is also possible. Perhaps shy children cause parents to linger. Thus this study led to two alternative hypotheses: More research is needed to ascertain which one is more accurate.
The Experiment
The experiment establishes what causes what. In the social sciences, experimenters typically impose a particular treatment on a group of volunteer participants or expose them to a specific condition and then note whether their behavior changes.
In technical terms, the experimenters manipulate an independent variable, which is the imposed treatment or special condition (also called the experimental variable; a variable is anything that can vary). They note whether this independent variable affects whatever they are studying, called the dependent variable (which depends on the independent variable).
Thus, the independent variable is the new, special treatment; any change in the dependent variable is the result. The purpose of an experiment is to find out whether an independent variable affects the dependent variable. In a typical experiment (as diagrammed in Figure 1.7), two groups of participants are studied. One group, the experimental group, is subjected to the particular treatment or condition (the independent variable); the other group, the comparison group (also called the control group), is not.
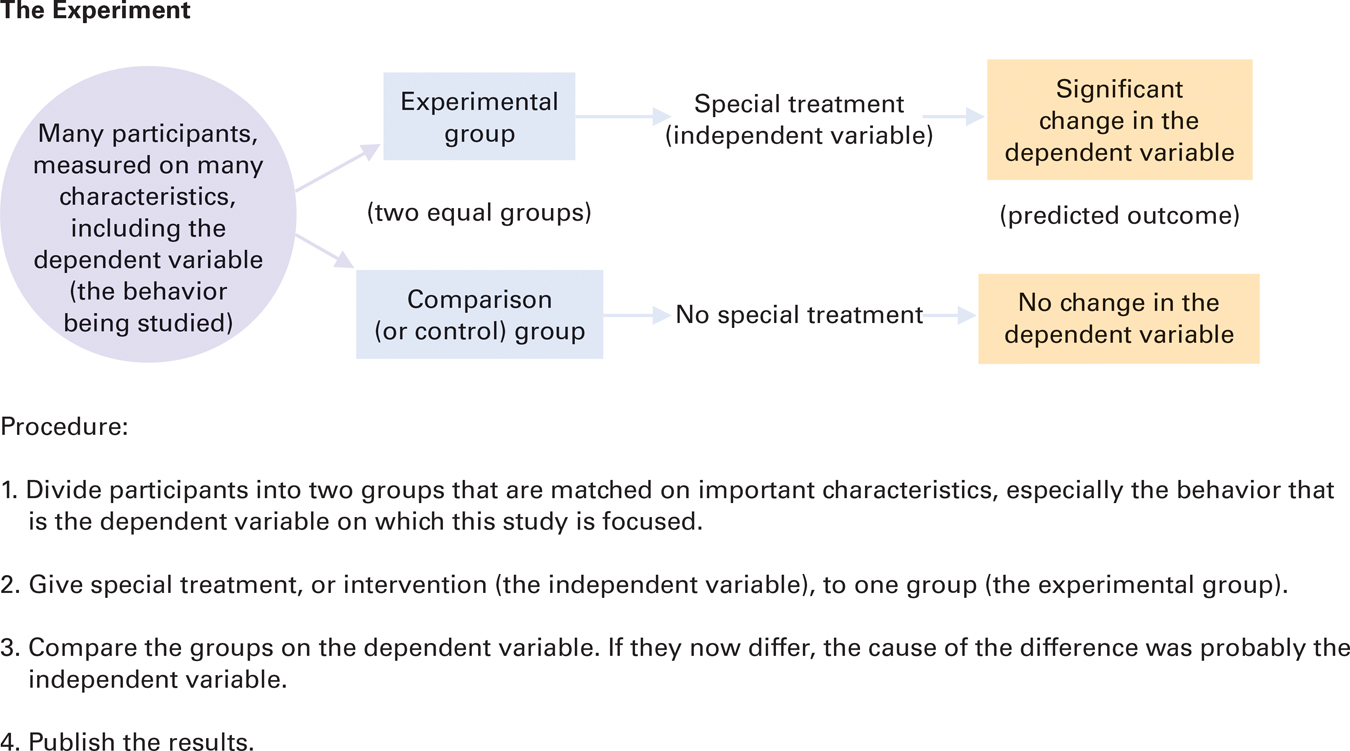
How to Conduct an Experiment The basic sequence diagrammed here applies to all experiments. Many additional features, especially the statistical measures listed in Table 1.2 and various ways of reducing experimenter bias, affect whether publication occurs. (Scientific journals reject reports of experiments that were not rigorous in method and analysis.)
The Survey
A third research method is the survey, in which information is collected from a large number of people by interview, questionnaire, or some other means. This is a quick, direct way to obtain data.
Especially for Nurses In the field of medicine, why are experiments conducted to test new drugs and treatments?
Experiments are the only way to determine cause-
Unfortunately, although surveys may be quick and direct, they are not necessarily accurate. When pollsters try to predict elections, they survey thousands of potential voters. They hope that the people they survey will vote as they say they will, that undecided people will follow the trends, and that people who refuse to give their opinion, or who are not included, will be similar to those surveyed. None of this is certain. Some people lie, some change their minds, some (especially those who don’t have phones or who never talk to strangers) are never counted.
Furthermore, survey answers are influenced by the wording and the sequence of the questions. For instance, according to many scientists, “climate change” and “global warming” are two ways to describe the same phenomenon, yet many people believe in climate change but not in global warming (McCright & Dunlap, 2011). For that reason, surveys that seem to be about the same issue may reach opposite conclusions.
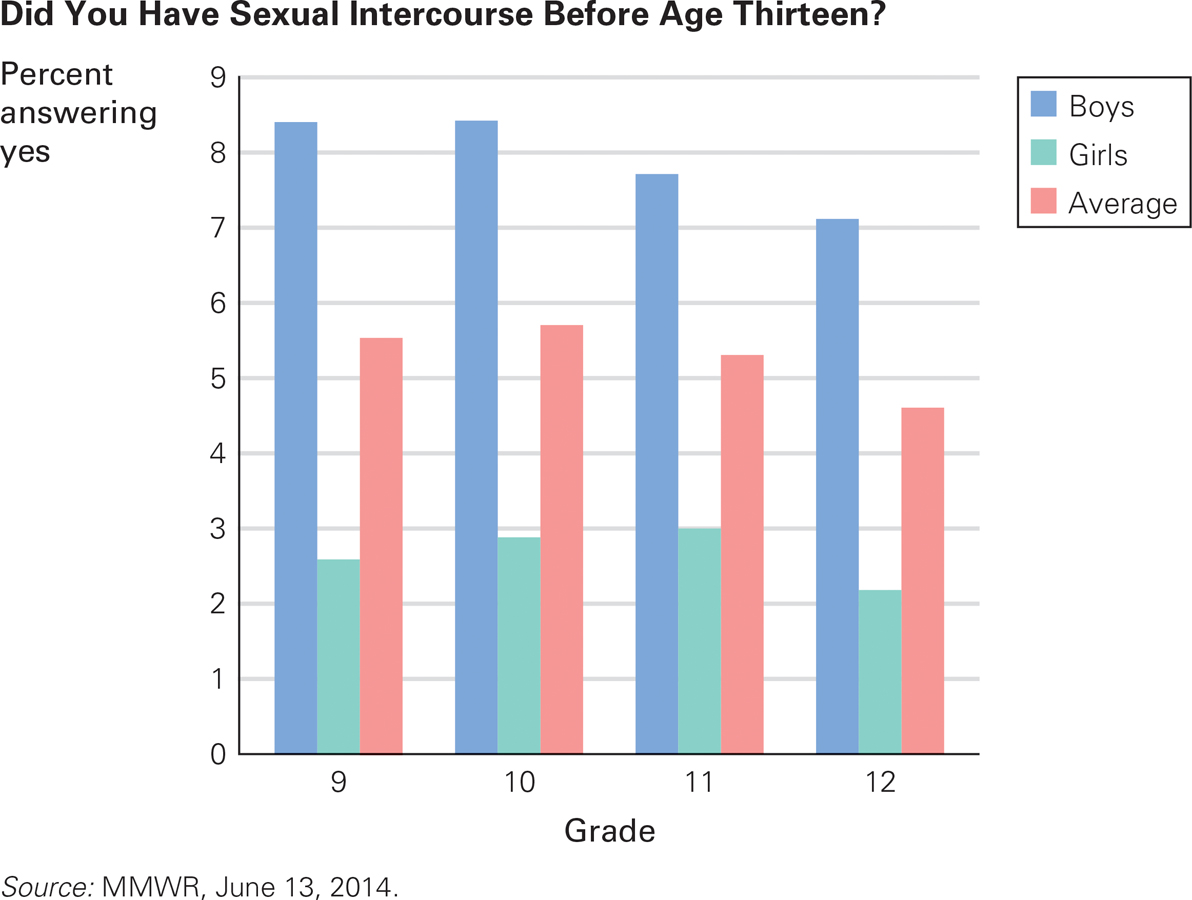
I Forgot? If this were the only data available, you might conclude that ninth-
Additionally, survey respondents present themselves as they would like to be perceived. For instance, every two years since 1991, high school students in the United States have been surveyed. The participants are carefully chosen to be representative of all students in the nation. The most recent survey included 13,633 students from all 50 states and from schools large and small, public and private (MMWR, June 13, 2014).
Students are asked whether they had sexual intercourse before age 13. Every year, compared to the twelfth-
To understand responses in more depth, another method can be used—
Even if accurate, the case study applies only to one person, who may be quite unlike other people. For instance, my report on my nephew David is a case study, but David is unique: Other embryos exposed to rubella may have quite different lives than David’s.
Studying Development over the Life Span
In addition to conducting observations, experiments, and surveys, developmentalists must be mindful of the last part of our definition of the science of human development—
Which Approach Is Best? Cross-
Question 1.19
OBSERVATION QUIZ Longitudinal research best illustrates continuity and discontinuity. For Sarah-
Of course, much changed and much did not change, but evident in the photos is continuity in Sarah–

Cross-Sectional Research
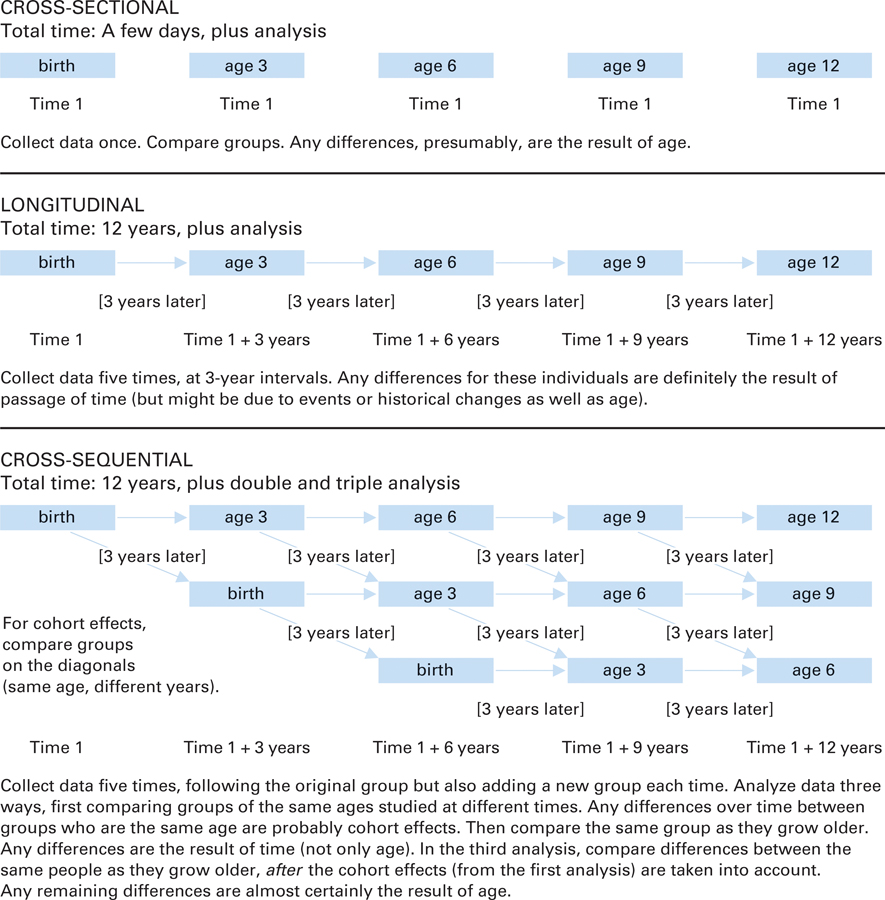
The quickest and least expensive way to study development over time is with cross-
Cross-
Longitudinal Research
To help discover whether age itself rather than cohort causes a developmental change, scientists undertake longitudinal research. This research requires collecting data repeatedly on the same individuals as they age. Longitudinal research is particularly useful in tracing development over many years.
Longitudinal research has several drawbacks, however. Over time, participants may withdraw, move to an unknown address, or die. Another problem is that participants become increasingly aware of the goals of the study—
Finally, the historical context changes, which limits the current relevance of data on people born decades ago. Results from longitudinal studies of people born in 1910 may not be applicable to people born in 2010.
Especially for Future Researchers What is the best method for collecting data?
There is no best method for collecting data. The method used depends on many factors, such as the age of participants (infants can't complete questionnaires), the question being researched, and the time frame.
Longitudinal research requires years of data. For example, alarm about possible future harm caused by ingesting phthalates and bisphenol A (BPA) (chemicals used in manufacturing) from plastic baby bottles and infant toys leads many parents to use glass baby bottles. But perhaps the risk of occasional shattered glass causes more harm than the chemicals in plastic, or perhaps the mother’s use of cosmetics, which puts phthalates in breast milk, is a much greater source of the chemicals than any bottles (Wittassek et al., 2011).
Could breast-
Another issue is whether e-
Cross-Sequential Research
Scientists have found a third strategy, called cross-
With cross-
If those 6-
Here is one example. Cross-

SUMMING UP Scientists use many methods and research designs to investigate development. Ideally, conclusions from one type of study are confirmed by other types. For example, careful and systematic observation can discover phenomena that were previously unnoticed, and then experiments can uncover causes. Surveys are quick but vulnerable to bias in the questions asked, the answers given, and the interpretation of those answers. Case studies are detailed, but it is folly to draw general conclusions from the details of any one individual.
To study change over time, cross-
WHAT HAVE YOU LEARNED?
Question 1.20
How do scientific observation and experimentation differ?
Scientific observation is a method of testing a hypothesis by unobtrusively watching and recording participants' behavior in a systematic and objective manner—in a natural setting, in a laboratory, or in searches of archival data. An experiment is designed to determine cause and effect. In contrast to scientific observation, researchers in an experiment control the participants and the interventions. Question 1.21
Why do experimenters use a control (or comparison) group as well as an experimental group?
The purpose of an experiment is to find out whether an independent variable affects the dependent variable. In a typical experiment, two groups of participants are studied. One group, the experimental group, is subjected to the particular treatment or condition (the independent variable) while the other group, the comparison group (also called the control group), is not.Question 1.22
What are the strengths and weaknesses of the survey method?
The biggest strengths of the survey method are that it is quick and direct. Its biggest weakness is that answers may not be accurate because people may lie, want to come across favorably, or be influenced by the wording of the questions.Question 1.23
What are the advantages and disadvantages of cross-
sectional research? The cross–sectional approach is the quickest and least expensive way to study development over time. In this type of research, groups of people of one age are compared with groups of people of another age. However, a weakness is that it is difficult to ensure that the various groups being compared are similar in every way except age. Question 1.24
What are the advantages and disadvantages of longitudinal research?
The biggest advantage of longitudinal research is that it is useful in tracing development over many years. Disadvantages include dropout of participants, participants becoming increasingly aware of the questions or the goals of the study, and the influence of the historical context.Question 1.25
What are the advantages and disadvantages of cross-
sequential research? A cross–sequential design lets researchers study several groups at different ages (like a cross– sectional study does) and follow them over time (like a longitudinal study does). However, cross– sectional research can be affected by historical changes, which may skew the results.