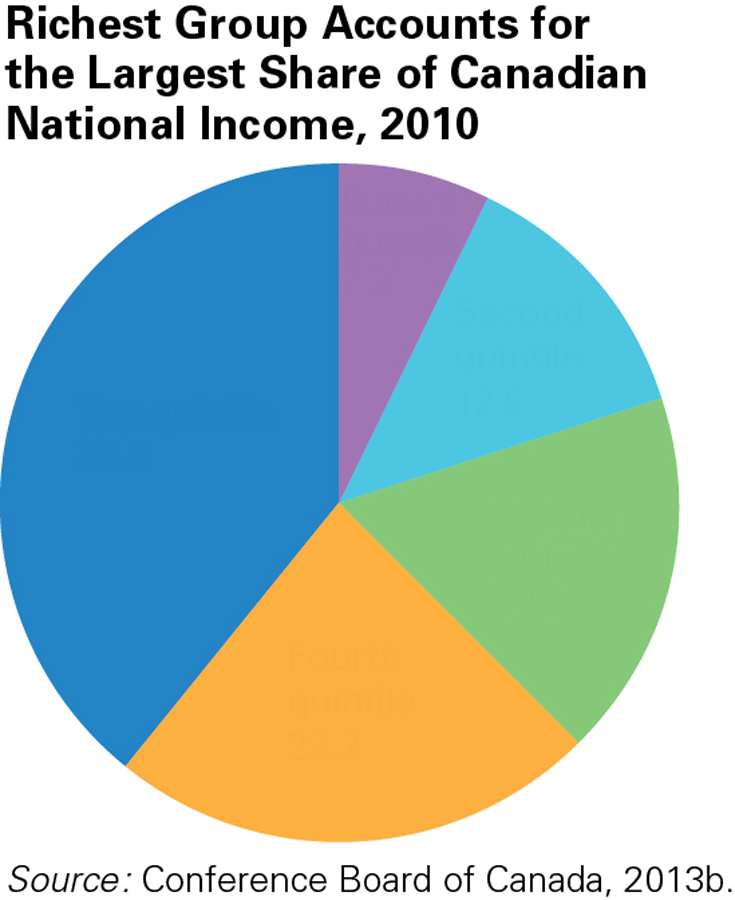
FIGURE 12.3 Richer/Poorer One way to track income inequality is by dividing the population into five groups (quintiles), and then calculating each group’s share of income. If each group has the same share of the nation’s total income—i.e., 20 percent—then the distribution is equal. As this graph shows, the richest income group in Canada has by far the largest share of the total national income. This group was also the only group to increase its share of the national income over the last 20 years; every other group has lost share (Conference Board of Canada, 2013b).
Source: Conference Board of Canada, 2013b.
[Leave] [Close]