7.4 Teaching and Learning
As we have just described, 6-
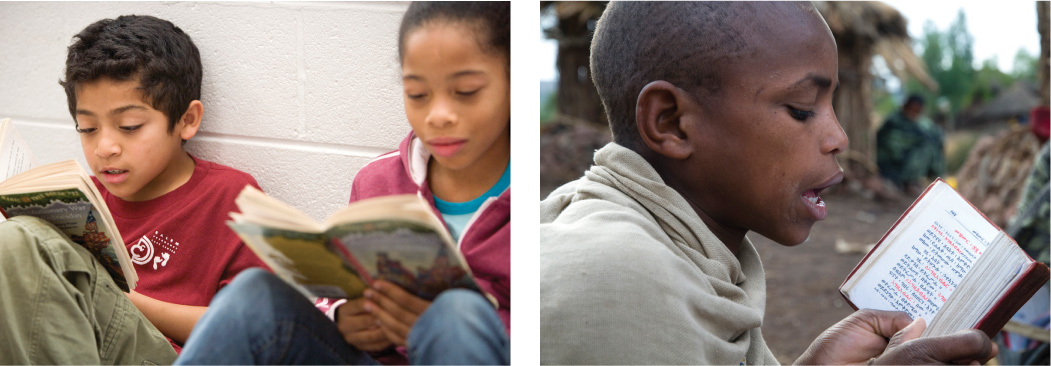
Traditionally, children were taught domestic tasks and agriculture at home, but now more than 95 percent of the world’s 7-
268
Schools Around the World
Although literacy and numeracy (reading and math) are goals for all children almost everywhere, curricula vary by nation, by community, and by subject. In France in 2000, for example, children had physical education for three hours and arts instruction for more than two hours each week (Marlow-
Educational practices also differ radically even between nations that are geographically close. For example, in Germany the average school child studies science three times more often than in the Netherlands (Snyder & Dillow, 2010).
The Hidden CurriculumVariation is even greater in aspects of the hidden curriculum, which refers to implicit values and assumptions evident in course selection, schedules, teacher characteristics, discipline, teaching methods, sports competition, student government, extracurricular activities, and so on. Even within countries, such practices differ. Children from a higher SES are more likely to know about and abide with the “unwritten rules” of the hidden curriculum than their classmates from a lower SES (Apple, 1975).
Whether students should be quiet or talkative in class is part of the hidden curriculum, taught to students from kindergarten on. In some countries, students are expected to stand when called on by the teacher and rarely participate in class discussions. In others, students remain seated when responding to the teacher and are more likely to speak spontaneously during discussions.
A curriculum of social values is expressed in the school’s physical setting, which might include spacious classrooms, wide hallways, and large, grassy playgrounds—
OLIVIER CIRENDINI/LONELY PLANET/GETTY IMAGES
269
International TestingOver the past two decades, more than 50 nations have participated in massive tests of educational achievement. The results of these tests are carefully studied by political leaders: if achievement rises, the national economy advances—
Science and math are tested in the Trends in Math and Science Study (TIMSS). The main test of reading is the Progress in International Reading Literacy Study (PIRLS). Both of these tests have been given several times, with East Asian nations usually at the top, the United States rising, and Canada somewhere behind the U.S. (see Tables 7.2 and 7.3). Most developing nations do not give these tests, but when they do, scores are low.
Many experts wonder what factors produce higher achievement. Teachers are thought to be crucial. For example, Finland, which scores high on many tests, allows only the top 3 percent of high school graduates to enter teachers’ colleges. Then they are given five years of free college education, including a Master’s degree in education theory and practice, as well as advanced training in an academic discipline.
Finnish teachers are also granted more autonomy within their classrooms than is typical in other systems, and they have time and are encouraged to collaborate with colleagues (Sahlberg, 2011). Buildings are designed to foster such collaboration, with comfortable teachers’ lounges. Teachers might be the reason for Finland’s success, or it may be something more basic regarding Finland’s size, population, culture, or history.
| Rank* | Country | Score |
|---|---|---|
| 1. | Singapore | 606 |
| 2. | Korea | 605 |
| 3. | Hong Kong | 602 |
| 4. | Chinese Taipei | 591 |
| 5. | Japan | 585 |
| 6. | N. Ireland | 562 |
| 7. | Belgium | 549 |
| 8. | Finland | 545 |
| 9. | England | 542 |
| 10. | Russia | 542 |
| 11. | United States | 541 |
| 12. | Netherlands | 540 |
| Canada (Quebec) | 533 | |
| Germany | 528 | |
| Canada (Ontario) | 518 | |
| Australia | 516 | |
| Italy | 508 | |
| Sweden | 504 | |
| New Zealand | 486 | |
| Iran | 431 | |
| Yemen | 248 | |
| *The top 12 groups are listed in order, but after that not all the jurisdictions that took the test are listed. Some nations have improved over the past 15 years (notably, Hong Kong, England) and some have declined (Austria, Netherlands), but most continue about where they have always been. | ||
| Sources: Mullis et al., 2012a; Provasnik et al., 2012. | ||
| Country | Score |
|---|---|
| Hong Kong | 571 |
| Russia | 568 |
| Finland | 568 |
| Singapore | 567 |
| N. Ireland | 558 |
| United States | 556 |
| Denmark | 554 |
| Chinese Taipei | 553 |
| Ireland | 552 |
| England | 552 |
| Canada | 548 |
| Italy | 541 |
| Germany | 541 |
| Israel | 541 |
| New Zealand | 531 |
| Australia | 527 |
| Poland | 526 |
| France | 520 |
| Spain | 513 |
| Iran | 457 |
| Colombia | 448 |
| Indonesia | 428 |
| Morocco | 310 |
| Source: Mullis et al., 2012b. | |
270
In one study that examined the impact of teachers on their students’ achievement, TIMSS experts videotaped 231 math classes in three nations—
Gender Differences in School PerformanceIn addition to marked national, ethnic, and economic differences, gender differences in achievement scores are often reported. The PIRLS finds girls ahead of boys in verbal skills in every country, and, traditionally, the TIMSS has found boys ahead of girls in math and science. However, the most recent TIMSS results indicate that gender differences in math have narrowed or disappeared. In Grade 4, there were no significant differences in results for boys and girls in 26 of the 50 participating countries, while boys did slightly better in 20 countries and girls did significantly better in the remaining 4 countries (Mullis et al., 2012a). Such results lead to a gender-
Academic achievement also differs by age. While girls usually have higher grades overall, at puberty girls’ achievement dips, especially in science. Many reasons for these differences have been suggested (Halpern et al., 2007). For instance, girls in elementary school see their teachers, who are usually female, teaching all subjects and they feel or are encouraged by them. However, as they get older, they may have more male teachers teaching science and math and conclude that women don’t need expertise in calculus or biology (Weisgram et al., 2010). For that reason, their motivation may falter in science and math.
271
Research on Grade 5 students with high IQs found an intriguing gender difference: When academic material became confusing, girls were less likely to persevere, but boys enjoyed the challenge (Dweck, 2007). Such discrepancies could be explained by nature or nurture.
However, do not make too much of these explanations for gender differences in school achievement. When scores are compared, gender differences are tiny compared with SES or national ones. The huge difference in test results between Hong Kong and Yemen (667 and 224) dwarfs the 10-
Education In Canada
Unlike most nations, Canada does not have a national department of education to set and administer policies across the country. This is because section 23 of the Constitution Act, 1867 gives sole authority for education to the individual provinces and territories, stating that “in and for each province, the legislature may exclusively make laws in relation to education.” The funding for education at both the primary and secondary level comes from a mixture of federal transfer payments and provincial or territorial and local taxes. In every province and territory, primary schooling is administered by local school boards.
Across the country, education is free and attendance is compulsory from about the age of 6 to 16, except in Manitoba, New Brunswick, and Ontario, where students must attend until they are 18. The federal government is in charge of funding the education of First Nations students in Canada.
Provincial and Territorial ResponsibilitiesSince each province or territory is completely autonomous in regard to educational matters, each has the authority to develop its own curriculum, set standards for teacher training, and approve textbooks and other instructional materials. Each province or territory has also established a series of standardized tests to measure student achievement.
As a result of each province or territory developing its own policy independently of others, there are some notable differences in primary education across Canada. For example, provinces and territories differ in the extent to which they fund full-
Advocates of full-
Other interprovincial/territorial differences in primary education include the extent to which each province funds denominational schools. For example, British Columbia has a single public school system, while Ontario, Saskatchewan, Newfoundland and Labrador, Quebec, Northwest Territories, Yukon, and Alberta fully fund both public and Catholic school boards. In addition, only five provinces fund private schools; in all other provinces and territories, private schools must raise money for most of their operating expenses through tuition fees. Finally, there are provincial differences in when elementary school ends, ranging from Grade 5 (New Brunswick), to Grade 6 (Alberta), to Grade 7 (British Columbia), to Grade 8 (Ontario).
272
Despite these differences in approach, the overall expectations that the provinces and territories set for their students and the achievement levels these students reach are remarkably similar across the country, as we shall now see.
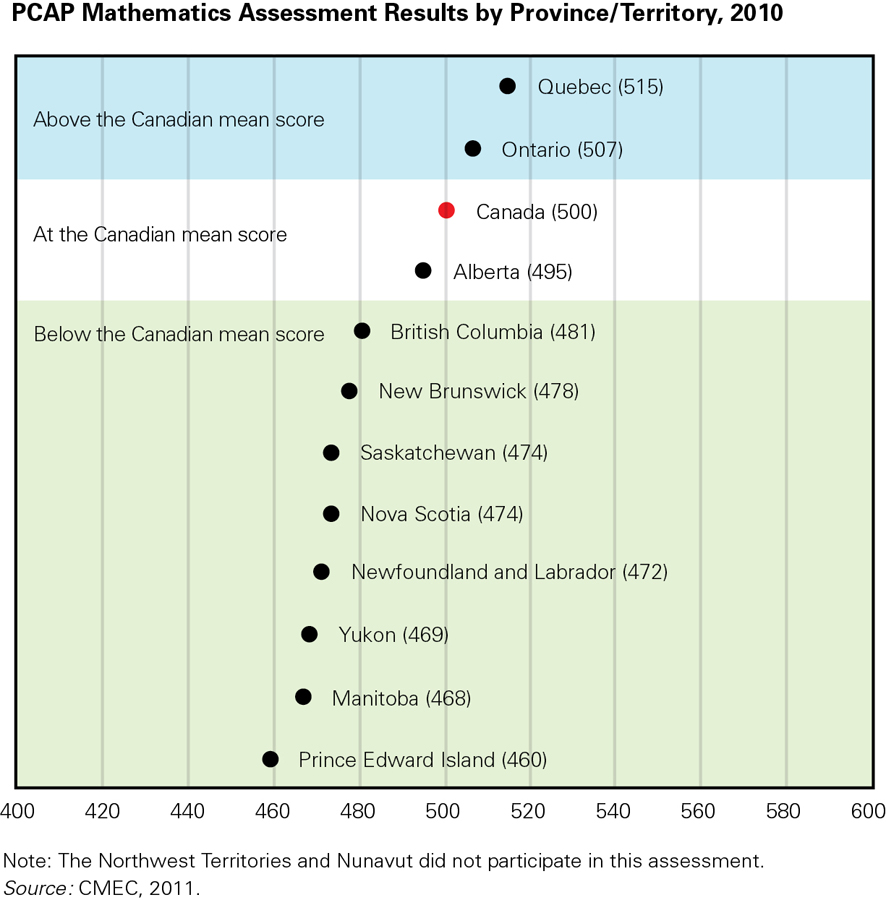
National StandardsSince Canada has no federal department of education, the government does not administer or sponsor any kind of national test to measure student achievement. However, the Council of Ministers of Education, Canada (CMEC), an intergovernmental organization whose membership consists of the ministers and deputy ministers of education from all the provinces and territories, does administer one such test. Every three years since 2007, the Pan-
The PCAP does not test every Grade 8 class in the country. Rather, certain schools and certain classes within those schools are randomly chosen each time the test is given to provide a comprehensive sampling. Figure 7.5 shows provincial results for the PCAP’s mathematics assessment in 2010.
273
The CMEC is also involved with administering the Organisation for Economic Co-
Aboriginal EducationThe recent history of primary education among Aboriginal peoples (First Nations, Inuit, and Métis) in Canada has been marked by two ongoing struggles: the struggle to regain control over their children’s education and the struggle to ensure that the quality of that education is at least on a par with that enjoyed by other Canadian children.
Today, most on-
Most Métis children go to non-
It was not always so. Unfortunately in the twentieth century, most of the education of Aboriginal children in Canada took place under the shadow of the residential school system and the many abuses—
Most of these traditional systems disappeared after the establishment of residential schools in the late nineteenth century. Many of the schools were some distance away from the reserve or local community, which meant that the children who attended them were separated from their families for months or years at a time. Although the federal government funded the schools, Christian churches ran most of them. The teachers were often priests or ministers whose stated objective was to “civilize” the children in their care and assimilate them into the dominant culture of the time. In these schools, the teachers punished the children for speaking their own language, for practising their own religion, and for taking part in cultural ceremonies such as dancing, drumming, or smudging.
The developmental damage many of these children suffered was severe. Separation from their families deprived Aboriginal children of their parents’ love and example. Not only did this mean that the children themselves developed emotional problems, but they also had difficulties relating to their own children later on. In this way, the damage has continued for generations. In addition to these obvious impacts, thousands of well-
274
Although many Aboriginal parents and community leaders complained about the schools from the very beginning, nothing substantive happened to change the system until after the 1960s. It was only in 1960 that First Nations won the right to vote in federal elections, and this encouraged a political movement among First Nations and Inuit leaders to acquire the rights of full citizenship. Education became a focus of this movement, most forcefully expressed in the National Indian Brotherhood’s 1972 publication called “Indian Control of Indian Education.” This document had a strong influence on government policy in the following years, resulting in the eventual closing of the residential schools, which were replaced by new schools on reserves and in Inuit communities. To a large extent, these new schools were staffed by Aboriginal teachers. The curricula focused on the children maintaining knowledge of Aboriginal languages and traditions.
Today, however, many of the statistics associated with Aboriginal schooling are still so troubling that educators often refer to an “Aboriginal education gap” in Canada. For example, according to a report by the Canadian Council on Learning (CCL), in 2006,
- 40 percent of Aboriginal people aged 20 to 24 did not have a high school diploma, while the dropout rate for non-
Aboriginal people was only 13 percent - only 8 percent of Aboriginal people had completed a university degree, while the rate for non-
Aboriginals was 23 percent (CCL, 2009).
There can be little doubt that high school and university attainment rates are directly linked to achievements at the elementary school level. It seems more than likely that part of the discrepancy that now exists between achievement levels of Aboriginal primary students and their non-
Groups such as the Assembly of First Nations have been working with the federal government to equalize funding for Aboriginal students, but no comprehensive solution has emerged so far. Some on-
The need to equalize funding for all Aboriginal students is urgent if only because Aboriginal peoples are the youngest and fastest-
275
Measuring the Mind
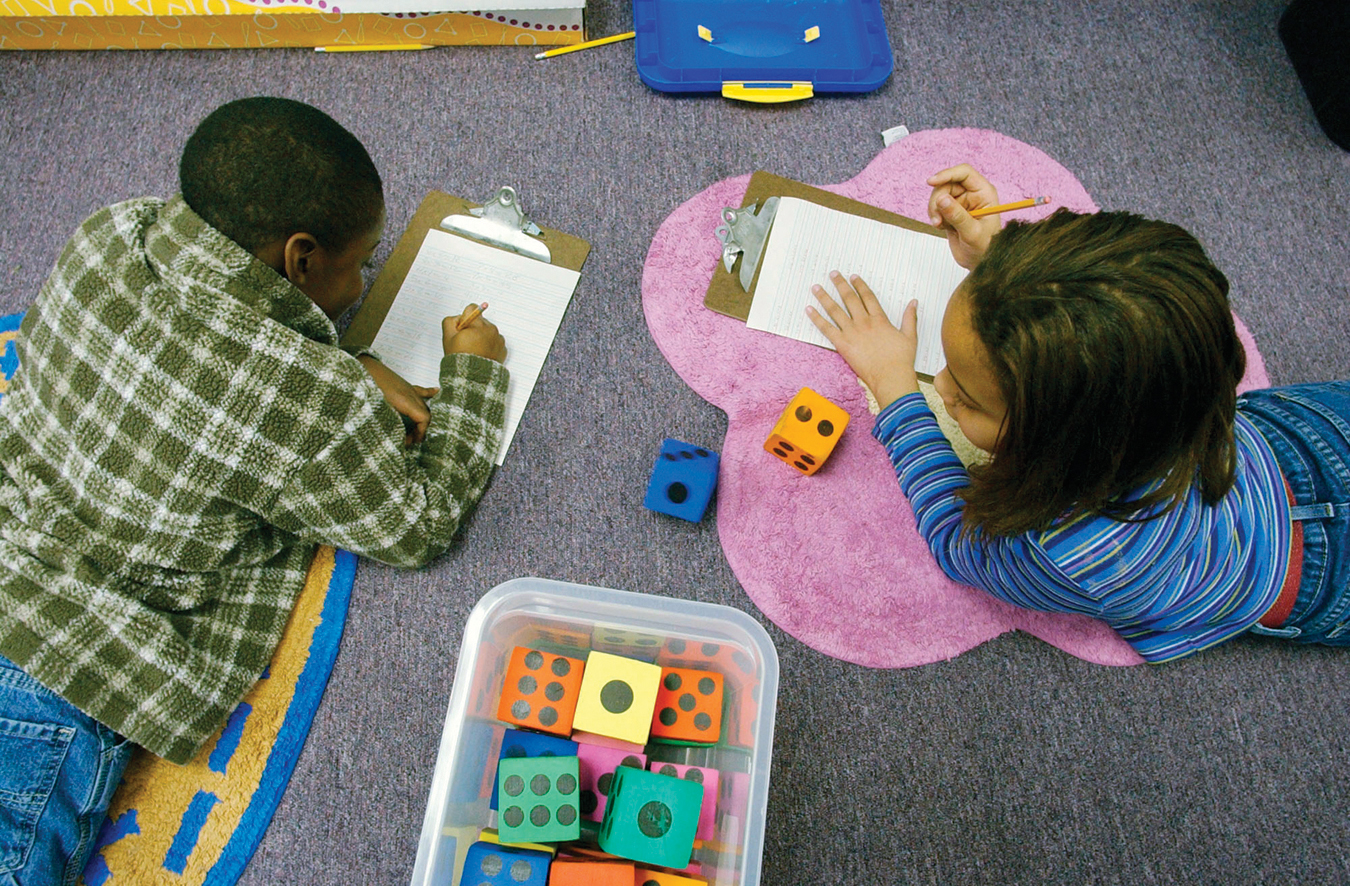
An underlying question is: Who should be taught in which way? Some children are ahead of others even before they enter school. Such early advances typically increase with age. Differential susceptibility and individual capacity mean that strate gies, pacing, and curriculum details need to be tailored to the particular nature of the child (Kegel et al., 2011). One example is that reading scores rise with early phonic instruction for low-
Aptitude, Achievement, And IqIn theory, aptitude is the potential to master a specific skill or to learn a certain body of knowledge. Intellectual aptitude is often measured by intelligence quotient (IQ) tests. Alfred Binet developed IQ tests in 1904 because he saw that children who did not achieve in school were beaten, shamed, and excluded. He wondered if their aptitude rendered them unable to achieve at grade level. Since IQ tests identified those children with lower aptitude, they could be protected from being abused as a result of their inability to achieve. Binet’s tests were revised and published as the Stanford-
Originally, an IQ score was literally a quotient: Mental age (the age of a typical child who had reached the tested child’s intellectual level) was divided by chronological age (the tested child’s actual age), and the result of that division (the quotient) was multiplied by 100. If mental age was the same as chronological age, the quotient would be 1, and the child’s IQ would be 100, exactly average. The current method of calculating IQ is more complicated, but an IQ of 100 is still considered average.
In theory, achievement is learning that has occurred, not learning potential (aptitude). Achievement tests compare scores to norms established for each grade. For example, children of any age whose reading is typical of the average Grade 3 student are said to be at the Grade 3 level in reading achievement.
The words in theory precede the definitions of aptitude and achievement. Although potential and accomplishment are supposed to be distinct, IQ and achievement scores are strongly correlated for individuals, for groups of children, and for nations (Lynn & Mikk, 2007). Binet assumed that some children did not achieve much because of their low IQ, but perhaps low achievement was a cause (not just a result) of low IQ. Or perhaps some third factor (such as malnutrition) decreases both IQ and achievement.
Moreover, people once thought that aptitude was a fixed characteristic, present at birth—
Multiple IntelligencesSocial scientists agree that the IQ score is only a snapshot—
276
Children may instead inherit a set of abilities, some high and some low, rather than a general intellectual ability (e.g., Q. Zhu et al., 2010). Two leading developmentalists, Robert Sternberg and Howard Gardner, are among those who believe that humans have multiple intelligences, not just one (Furnham, 2012).
Robert Sternberg (1996) described three distinct types of intelligence: academic, measured by IQ and achievement tests; creative, evidenced by imaginative endeavours; and practical, seen in everyday problem solving. In contrast, Howard Gardner originally (1983) described seven intelligences: linguistic, logical-
Although every normal (not severely brain damaged) person has some of all nine intelligences, Gardner believes each individual has highs and lows. For example, someone might be gifted spatially but not linguistically (a visual artist who cannot describe her work), or might have interpersonal but not naturalistic intelligence (an astute clinical psychologist whose houseplants die).
ESPECIALLY FOR Teachers What are the advantages and disadvantages of using Gardner’s idea of multiple intelligences to guide your classroom curriculum? ![]()
The advantages are that all the children learn more aspects of human knowledge and many can develop their talents. Art, music, and sports should be an integral part of education, not just a break from academics. The disadvantage is that they take time and attention away from reading and math, which might lead to less proficiency in those subjects on standardized tests. 
Gardner’s theory has been influential in education, especially the education of children (e.g., Armstrong, 2009; Rettig, 2005), when teachers allow children to demonstrate knowledge in their own ways—
Similarly, Sternberg believes that matching instruction to a person’s analytic, creative, or practical ability advances his or her comprehension. However, these applications may not be supported by scientific research (Almeida et al., 2010; Pashler et al., 2008). Debate continues about whether intelligence is general or multiple, whether learning styles are relevant to achievement, and what the educational implications of aptitude and achievement scores might be (Furnham, 2012).
Cultural VariationsOne final criticism of IQ testing arises from two aspects of the life-
The IQ tests considered most accurate (the WISC [Wechsler Intelligence Scale for Children] and the Stanford-
Yet remember that children reflect the hidden curricula. In some cultures, individuals are taught to consider themselves part of a group, and the intellectually gifted are particularly adept at working with others. In such cultures, a child’s intellect may be more evident in social interaction, not in isolation. In Africa, for instance, testing an isolated child’s IQ might not indicate potential (Nsamenang, 2004). Furthermore, if some children have been taught to be quiet and respectful, they might not readily answer questions posed by an unfamiliar professional. As a result, their IQ would not reflect their potential.
277
KEY Points
- Children worldwide attend school, but curricula, teaching methods, settings, and much else differ from one country to another.
- International tests of achievement usually find children in East Asian nations scoring far above Canadian children, and above children in many other countries.
- Since education is a provincial/territorial rather than a federal responsibility in Canada, some regional differences are evident in approaches to primary education.
- On the whole, Aboriginal students lag behind their non-
Aboriginal peers, partly because of funding differences and the historical legacy of residential schools. - IQ tests are designed to measure aptitude and other tests measure achievement, but both are affected by culture and by assumptions about intelligence.