 Height Gains from Birth to Age 18
The range of height (on this page) and weight (see page A-
Same Data, Different Form
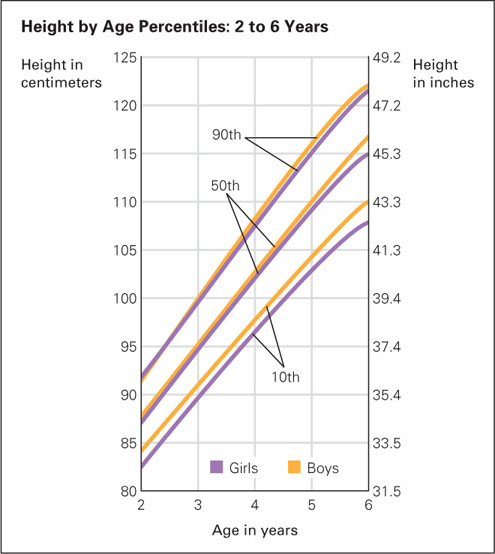
The columns of numbers in the table to the right provide detailed and precise information about height ranges for every year of childhood. The illustration above shows the same information in graphic form for ages 2–
| Boys: percentiles | Girls: percentiles | ||||||
|---|---|---|---|---|---|---|---|
| AGE | 10th | 50th | 90th | 10th | 50th | 90th | |
| Birth | 47.5 | 50.5 | 53.5 | 46.5 | 49.9 | 52.0 | |
| (18¾) | (20) | (21) | (18¼) | (19¾) | (20½) | ||
| 1 | 51.3 | 54.6 | 57.7 | 50.2 | 53.5 | 56.1 | |
| month | (20¼) | (21½) | (22¾) | (19¾) | (21) | (22) | |
| 3 | 57.7 | 61.1 | 64.5 | 56.2 | 59.5 | 62.7 | |
| months | (22¾) | (24) | (25½) | (22¼) | (23½) | (24¾) | |
| 6 | 64.4 | 67.8 | 71.3 | 62.6 | 65.9 | 69.4 | |
| months | (25¼) | (26¾) | (28) | (24¾) | (26) | (27¼) | |
| 9 | 69.1 | 72.3 | 75.9 | 67.0 | 70.4 | 74.0 | |
| months | (27¼) | (28½) | (30) | (26½) | (27¾) | (29¼) | |
| 12 | 72.8 | 76.1 | 79.8 | 70.8 | 74.3 | 78.0 | |
| months | (28¾) | (30) | (31½) | (27¾) | (29¼) | (30¾) | |
| 18 | 78.7 | 82.4 | 86.6 | 77.2 | 80.9 | 85.0 | |
| months | (31) | (32½) | (34) | (30½) | (31¾) | (33½) | |
| 24 | 83.5 | 87.6 | 92.2 | 82.5 | 86.5 | 90.8 | |
| months | (32¾) | (34½) | (36¼) | (32½) | (34) | (35¾) | |
| 3 | 90.3 | 94.9 | 100.1 | 89.3 | 94.1 | 99.0 | |
| years | (35½) | (37¼) | (39½) | (35¼) | (37) | (39) | |
| 4 | 97.3 | 102.9 | 108.2 | 96.4 | 101.6 | 106.6 | |
| years | (38¼) | (40½) | (42½) | (38) | (40) | (42) | |
| 5 | 103.7 | 109.9 | 115.4 | 102.7 | 108.4 | 113.8 | |
| years | (40¾) | (43¼) | (45½) | (40½) | (42¾) | (44¾) | |
| 6 | 109.6 | 116.1 | 121.9 | 108.4 | 114.6 | 120.8 | |
| years | (43½) | (45¾) | (48) | (42¾) | (45) | (47½) | |
| 7 | 115.0 | 121.7 | 127.9 | 113.6 | 120.6 | 127.6 | |
| years | (45¼) | (48) | (50¼) | (44¾) | (47½) | (50¼) | |
| 8 | 120.2 | 127.0 | 133.6 | 118.7 | 126.4 | 134.2 | |
| years | (47¼) | (50) | (52½) | (46¾) | (49¾) | (52¾) | |
| 9 | 125.2 | 132.2 | 139.4 | 123.9 | 132.2 | 140.7 | |
| years | (49½) | (52) | (55) | (48¾) | (52) | (55½) | |
| 10 | 130.1 | 137.5 | 145.5 | 129.5 | 138.3 | 147.2 | |
| years | (51¼) | (54¼) | (57¼) | (51) | (54½) | (58) | |
| 11 | 135.1 | 143.33 | 152.1 | 135.6 | 144.8 | 153.7 | |
| years | (53¼) | (56½) | (60) | (53½) | (57) | (60½) | |
| 12 | 140.3 | 149.7 | 159.4 | 142.3 | 151.5 | 160.0 | |
| years | (55¼) | (59) | (62¾) | (56) | (59¾) | (63) | |
| 13 | 145.8 | 156.5 | 167.0 | 148.0 | 157.1 | 165.3 | |
| years | (57½) | (61½) | (65¾) | (58¼) | (61¾) | (65) | |
| 14 | 151.8 | 63.1 | 173.8 | 151.5 | 160.4 | 168.7 | |
| years | (59¾) | (64¼) | (68½) | (59¾) | (63¼) | (66½) | |
| 15 | 158.2 | 169.0 | 178.9 | 153.2 | 161.8 | 170.5 | |
| years | (62¼) | (66½) | (70½) | (60¼) | (63¾) | (67¼) | |
| 16 | 163.9 | 173.5 | 182.4 | 154.1 | 162.4 | 171.1 | |
| years | (64½) | (68¼) | (71¾) | (60¾) | (64) | (67¼) | |
| 17 | 167.7 | 176.2 | 184.4 | 155.1 | 163.1 | 171.2 | |
| years | (66) | (69¼) | (72½) | (61) | (64¼) | (67½) | |
| 18 | 168.7 | 176.8 | 185.3 | 156.0 | 163.7 | 171.0 | |
| years | (66½) | (69½) | (73) | (61½) | (64½) | (67¼) | |
| Source: These data are those of the National Center for Health Statistics (NCHS), Health Resources Administration, DHHS. They were based on studies of The Fels Research Institute, Yellow Springs, Ohio. These data were first made available with the help of William M. Moore, M.D., of Ross Laboratories, who supplied the conversion from metric measurements to approximate inches and pounds. This help is gratefully acknowledged. | |||||||