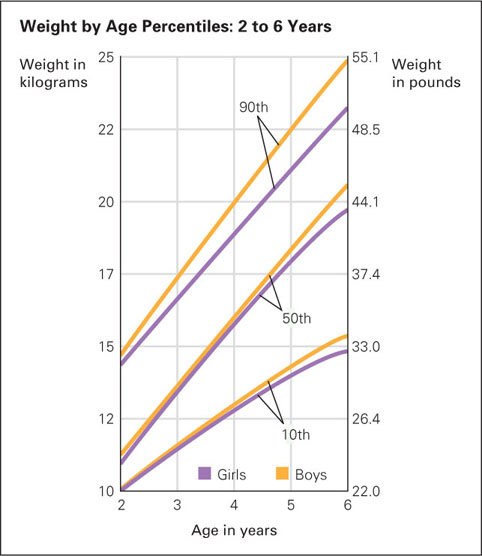
 Weight Gains from Birth to Age 18
These height and weight charts present rough guidelines; a child might differ from these norms and be quite healthy and normal. However, if a particular child shows a discrepancy between height and weight (e.g., at the 90th percentile in height but only the 20th percentile in weight) or is much larger or smaller than most children the same age, a pediatrician should see whether disease, malnutrition, or genetic abnormality could be part of the reason.

Table : Weight in Kilograms (and Pounds)
| Boys: percentiles | Girls: percentiles | |||||
|---|---|---|---|---|---|---|
| AGE | 10th | 50th | 90th | 10th | 50th | 90th |
| Birth | 2.78 | 3.27 | 3.82 | 2.58 | 3.23 | 3.64 |
| (6¼) | (7¼) | (8½) | (5¾) | (7) | (8) | |
| 1 | 3.43 | 4.29 | 5.14 | 3.22 | 3.98 | 4.65 |
| month | (7½) | (9½) | (11¼) | (7) | (8¾) | (10¼) |
| 3 | 4.78 | 5.98 | 7.14 | 4.47 | 5.40 | 6.39 |
| months | (10½) | (13¼) | (15¾) | (9¾) | (12) | (14) |
| 6 | 6.61 | 7.85 | 9.10 | 6.12 | 7.21 | 8.38 |
| months | (14½) | (17¼) | (20) | (13½) | (16) | (18½) |
| 9 | 7.95 | 9.18 | 10.49 | 7.34 | 8.56 | 9.83 |
| months | (17½) | (20¼) | (23¼) | (16¼) | (18¾) | (21¾) |
| 12 | 8.84 | 10.15 | 11.54 | 8.19 | 9.53 | 10.87 |
| months | (19½) | (22½) | (25½) | (18) | (21) | (24) |
| 18 | 9.92 | 11.47 | 13.05 | 9.30 | 10.82 | 12.30 |
| months | (21¾) | (25¼) | (28¾) | (20½) | (23¾) | (27) |
| 24 | 10.85 | 12.59 | 14.29 | 10.26 | 11.90 | 13.57 |
| months | (24) | (27¾) | (31½) | (22½) | (26¼) | (30) |
| 3 | 12.58 | 14.62 | 16.95 | 12.26 | 14.10 | 16.54 |
| years | (27¾) | (32¼) | (37¼) | (27) | (31) | (36½) |
| 4 | 14.24 | 16.69 | 19.32 | 13.84 | 15.96 | 18.93 |
| years | (31½) | (36¾) | (42½) | (30½) | (35¼) | (41¾) |
| 5 | 15.96 | 18.67 | 21.70 | 15.26 | 17.66 | 21.23 |
| years | (35¼) | (41¼) | (47¾) | (33¾) | (39) | (46¾) |
| 6 | 17.72 | 20.69 | 24.31 | 16.72 | 19.52 | 23.89 |
| years | (39) | (45½) | (53½) | (36¾) | (43) | (52¾) |
| 7 | 19.53 | 22.85 | 27.36 | 18.39 | 21.84 | 27.39 |
| years | (43) | (50¼) | (60¼) | (40½) | (48¼) | (60½) |
| 8 | 21.39 | 25.30 | 31.06 | 20.45 | 24.84 | 32.04 |
| years | (47¼) | (55¾) | (68½) | (45) | (54¾) | (70¾) |
| 9 | 23.33 | 28.13 | 35.57 | 22.92 | 28.46 | 37.60 |
| years | (51½) | (62) | (78½) | (50½) | (62¾) | (83) |
| 10 | 25.52 | 31.44 | 40.80 | 25.76 | 32.55 | 43.70 |
| years | (56¼) | (69¼) | (90) | (56¾) | (71¾) | (96¼) |
| 11 | 28.17 | 35.30 | 46.57 | 28.97 | 36.95 | 49.96 |
| years | (62) | (77¾) | (102¾) | (63¾) | (81½) | (110¼) |
| 12 | 31.46 | 39.78 | 52.73 | 32.53 | 41.53 | 55.99 |
| years | (69¼) | (87¾) | (116¼) | (71¼) | (91½) | (123½) |
| 13 | 35.60 | 44.95 | 59.12 | 36.35 | 46.10 | 61.45 |
| years | (78½) | (99) | (130¼) | (80¼) | (101¾) | (135½) |
| 14 | 40.64 | 50.77 | 65.57 | 40.11 | 50.28 | 66.04 |
| years | (89½) | (112) | (144½) | (88½) | (110¾) | (145½) |
| 15 | 46.06 | 56.71 | 71.91 | 43.38 | 53.68 | 69.64 |
| years | (101½) | (125) | (158½) | (95¾) | (118¼) | (153¼) |
| 16 | 51.16 | 62.10 | 77.97 | 45.78 | 55.89 | 71.68 |
| years | (112¾) | (137) | (172) | (101) | (123¼) | (158) |
| 17 | 55.28 | 66.31 | 83.58 | 47.04 | 56.69 | 72.38 |
| years | (121¾) | (146¼) | (184¼) | (103¾) | (125) | (159½) |
| 18 | 57.89 | 68.88 | 88.41 | 47.47 | 56.62 | 72.25 |
| years | (127½) | (151¾) | (195) | (104¾) | (124¾) | (159¼) |
| Source: Data are those of the National Center for Health Statistics, Health Resources Administration, DHHS, collected in its Health Examination Surveys. | ||||||
Page A-12
[Leave] [Close]