Chapter 12. Motivation or Achievement?: A Look at Various Nations’ PISA Scores

12.1 Synopsis

true
true
true
You must read each slide, and complete any questions on the slide, in sequence.

Welcome

Motivation or Achievement?: A Look at Various Nations’ PISA Scores

This activity demonstrates with an interactive map how U.S. students’ PISA (Programme of International Student Assessment) scores compare to those of other nations.

Click the 'Get Started' button below to start this activity
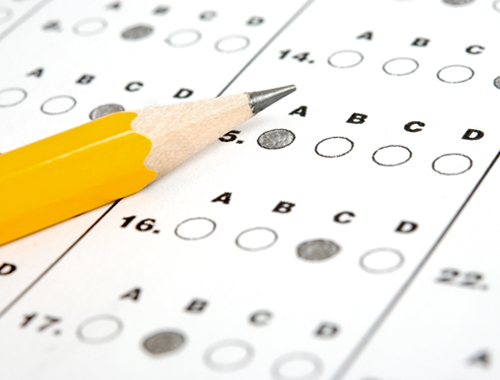
A sharpened pencil on a multiple choice Optical mark recognition (OMR) sheet.
Vitix/Shutterstock

12.2 Motivation or Achievement?: A Look at Various Nations’ PISA Scores

Programme of International Student Assessment (PISA)

The OECD’s Programme of International Student Assessment (PISA) is an international test of reading, mathematics, and science. Administered to 15-year-olds every three years, the PISA is designed to gauge how well students around the world have mastered these key subjects during their schooling thus far. Notice the high scores of Chinese students compared to the relatively low scores of U.S. students. Experts believe that students in the United States are not strongly motivated to learn—so they don’t.

CLICK ON EACH COUNTRY TO SEE ITS PISA SCORES AND RANKING FOR MATH, READING, AND SCIENCE.

A spreadsheet that shows data by PISA (Programme of International Student Assessment), an international test for 15-year-olds. The first column indicates countries around the world and the following columns indicate the three different PISA scores for math, reading, and science.

12.3 Motivation or Achievement?: A Look at Various Nations’ PISA Scores

PISA (Programme of International Student Assessment)

High school students dressed in their uniform sit in the classroom and study.
29september/Shutterstock

Question 12.1 Variations in PISA Scores

T25lIknA4WX1Whrzr0YPyMAxJkfKe1BV1IyvV52QngRxszbMiM+nenyQmfM6hR5lh1Xv9yzyQGaCg23dVFE842sYH82VbQSDbxoOBpup69D5aKMgyzqHvnvGlrLAxA2f5cZgs6ukQyPLkc2s4vThpFMhX/guqBkPUs/pKEIbIvLWPYNfYMLf9z6TLKWR+q6NBuYZJoIcRPB+LMX7m3u4L9Y0oWtg5dsneJHmYKMoSN+KcPHBpwtgGWoJppgIKmZ7InShrpZ0q23SzYT3aK0HEFhY/MM+lZd2vH1FWXZZNwLz72DKNmejl9b+ic6WjCb5mLU6WDFgXK39A8V36ol3alcvge3E02Qro5Q3Fynr0rK2JhOCAntCHMuYQQcJVPSK1TdWuPb41HUy2ABRX8nD1rlUXs+sq0SBgNIVXs4S2xAL/HN1UPvTQspbSBXUq3W/
Your answer could reference several different nations. For instance, Finland and Norway are close on the map but not in math achievement, and although most Asian nations do very well, Thailand scores low, as indicated by its omission from the map. Also, nations with a higher proportion of immigrants than the United States (e.g., Canada) or very few immigrants (e.g., Japan) seem to do equally well.

12.4 Activity Completed!

Congratulations! You have completed this activity.

REFERENCES

PISA. (2016). PISA 2015: Results in focus.. Paris, France: OECD.