Analyzing Maps: What to Look For
What features do you think mapmakers think are most important when designing a map for a general audience?
THE RHETORICAL SITUATION
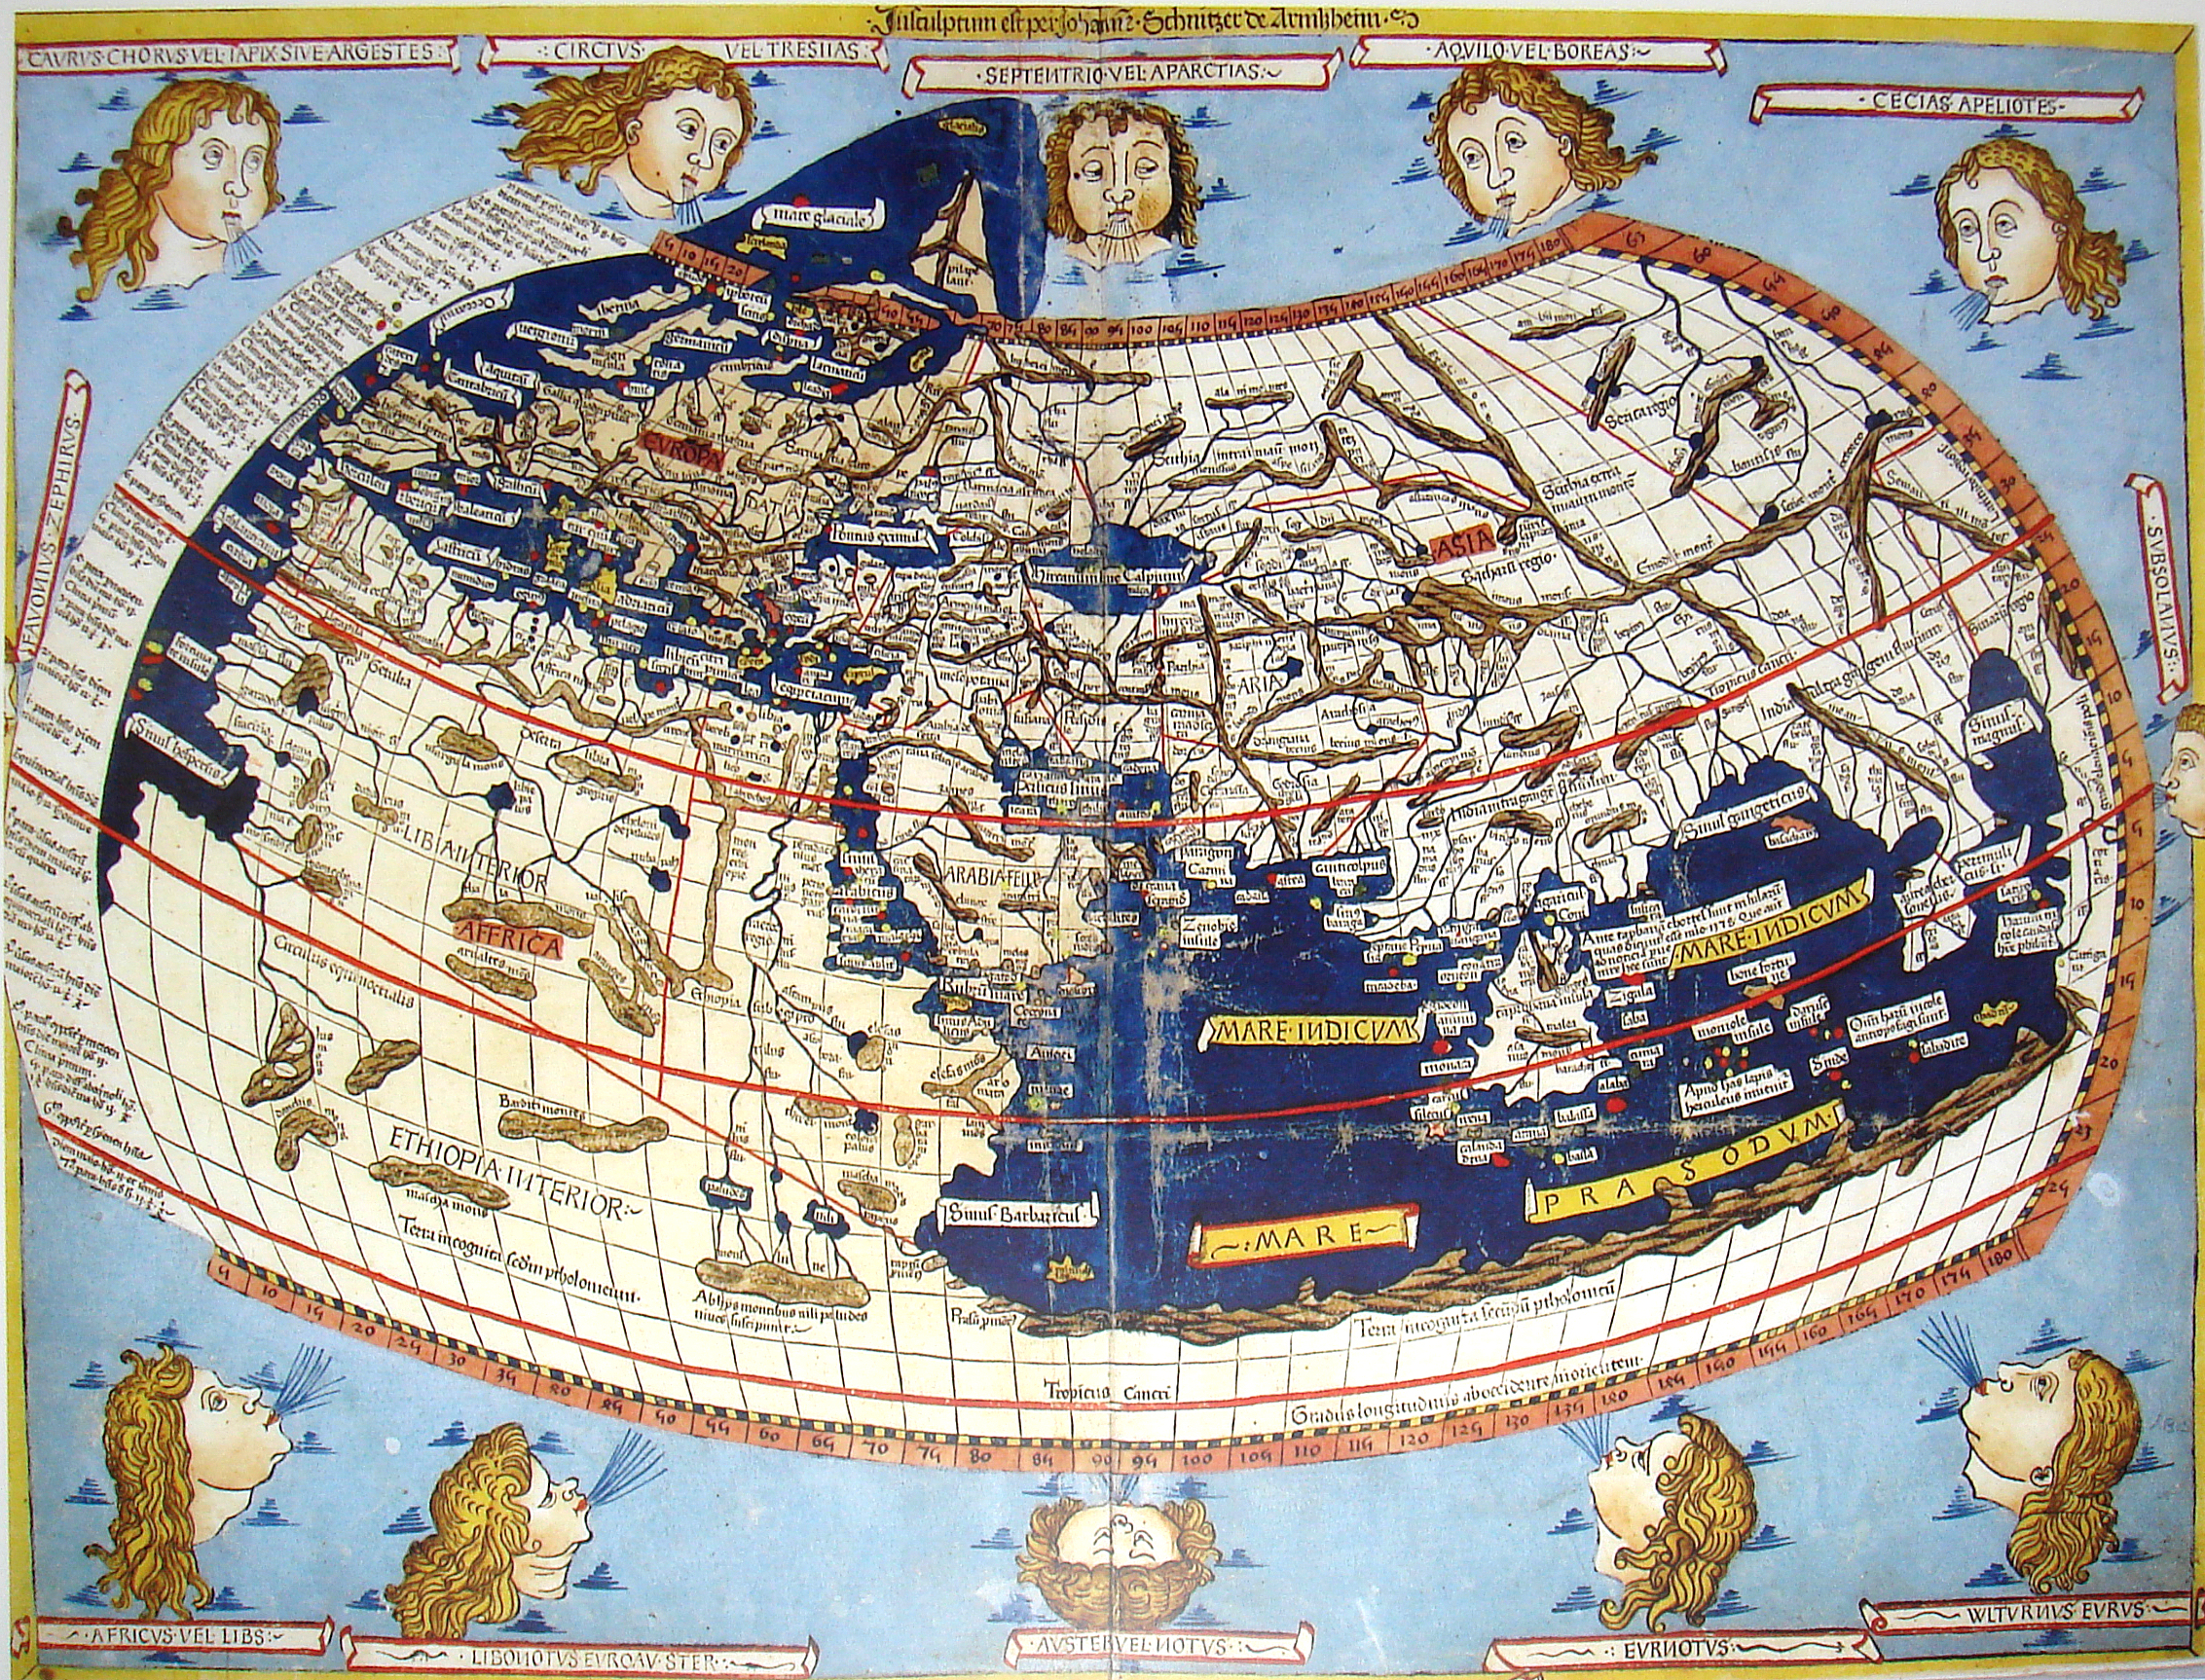
Purpose The purpose of the mapmaker is to visually represent an area—so readers can figure out the best route and driving distances between different points, understand the topography of a region, and see geographical landmarks and bodies of water. Maps can also provide a historical record, such as Ptolemy’s world map created in the second century, or a cultural or political record, such as the contemporary election map. (See also the map collection at the Library of Congress.)
Audience Mapmakers know that people mainly use maps to find the best route from one location to another, especially hikers who use topographical maps to discover trails. The creators of Google Earth maps imagined that educators might want to use the maps and “layers,” which include additional information about the places mapped, such as weather patterns and historical events, in their teaching. Makers of online interactive maps consider the needs of travelers; for example, just recently, Amy was trying to find a hotel for a vacation in Florida and used an online map to determine how close the hotel was to the beach.
Attention, mappers!
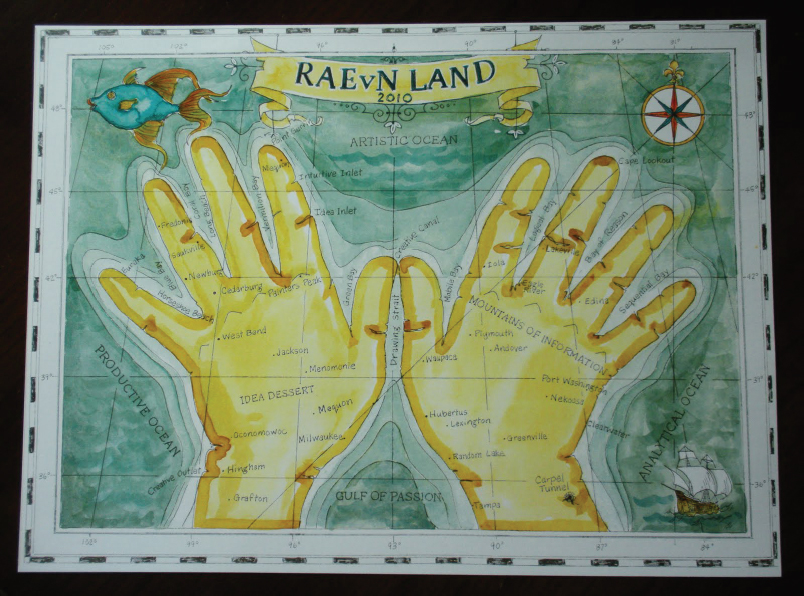
Keep in mind that maps do not have to represent real places. You can create a map to address concepts, ideas, and opinions—and to metaphorically illustrate dreams, memories, imaginary places, and personal geographies. Really, you can map just about anything.
Take a look at Kim Rae Nugent’s “RAEvN LAND” map. Unlike a logically organized, fact-based map, Nugent’s map is imaginative. Her ethos comes from her expertise in her own life; she also appeals to viewers through pathos (e.g., creativity and humor).
Rhetorical appeals Mapmakers rely mainly on ethos (authority) and logos (logic) to reach their readers. When you use a map, you trust that it accurately re-creates the topography of an area. However, if something happens to shake your trust—say you realize that your map mistakenly shows two parallel streets as intersecting, or you realize that your GPS doesn’t recognize streets that you’re passing—you would probably lose faith in the authority of your map (or your GPS’s source) and find an alternative. Good mapmakers follow certain conventions to appeal to users’ logos. For example, for a print map, they might use the same color and symbol to represent all hospitals or parks, and use variations in font size to indicate the size of a city; in an e-map, they might use an icon to indicate that more information can be viewed by hovering your cursor over the icon.
Modes & media Mapmakers generally use visuals and text to communicate, although GPS apps and devices also add audio. The visual aspects of the map, including colors and symbols, represent streets, rivers, and other geographical features. Often, color and text will work together; for example, a mapmaker might use bands of color with a text label to indicate the elevations of individual mountains in a mountain range. Makers of digital maps often add animation, as in the case of maps on smartphones thawt feature a color icon that shows you exactly where you are on the map, and moves on the map as you move. Mapmakers use text to label specific items, such as the names of cities and other landmarks, and to identify elements in the map’s legend or key. Maps can be printed or digital. Many digital maps are interactive, such as the maps on Google Earth, in which users can add different “layers” to maps of the world to highlight specific aspects, such as weather, trees, or street views.
Do you have a preference for using print maps or digital maps? Are there advantages to using one over the other? What are they?
THE GENRE’S CONVENTIONS
Elements of the genre
Based on solid data. The information presented in maps is based on careful surveying of land, or, as in Google Maps, on satellite photos.
Precise. Maps indicate distances and sizes accurately.
Clearly titled. Map titles are usually straightforward and specific. Aside from function-specific titles such as “BurgerMap,” maps can also be titled according to their location.
Clearly labeled. Labels help readers understand what is being presented. Digital maps have labels for streets, bridges, and places of interest, such as museums and parks. When the map is interactive and digital, users can also choose to have it show hotels, subway stations, and other features of interest.
Correctly oriented. Mapmakers usually orient objects so that north is up or at the top of the page or screen, south is down or at the bottom of the page or screen, east is right, and west is left.
Clarified through symbols and a legend (or key). Mapmakers use many visual cues to help readers grasp information quickly. They use conventional symbols, such as an image of an evergreen tree to indicate a park, a large capital H to indicate a hospital, and an image of a tent to indicate a campground. Mapmakers usually include a legend that tells the reader exactly what each symbol and color stands for.
Style
Detail. Mapmakers generally use minimal written detail, preferring to use clear visuals with very little text to convey information. Lots of text will slow down map users, while visual cues, such as color and symbols, can be understood quickly.
Techniques. Mapmakers use simple, direct language and also title their works as straightforwardly as possible so the map’s purpose is obvious to readers.
Tone and voice. Mapmakers use a neutral, objective tone to convey information without analysis, interpretation, or judgment.
Design
Varying type and feature sizes. The relative sizes of cities and other areas are indicated on a map by the type size: The name of larger cities and towns are shown in larger type sizes. Drivers using maps may be interested in the relative sizes of streets, for example, when choosing an efficient route.
Scale. Map users (especially when driving) need to see the distance between one place and another. Mapmakers include scales so that users can measure these distances; scales are usually provided in inches/feet/yards and miles/kilometers.
Direction. While most maps are oriented with north at the top or twelve o’clock position, it is still necessary to have a marker to show exactly where north is.
Colors. Mapmakers use a universal set of colors, such as brown for a landmass, green for vegetation (forests, parks, etc.), and blue for water.
Highway markers. Mapmakers use particular shapes, lines, and colors to indicate highways. For example, in the United States, the National Highway System mandates that interstate highways (e.g., I-44) be indicated with a blue shield with a red strip at the top, with a large number in white at the center of the shield. State highway shields have their own unique set of conventions for each state.
Zoomability and interactivity. Digital maps allow users to zoom in or zoom out to see more or less detail. “BurgerMap” is a digital map that allows users to zoom and interact with the content in different ways.
Sources Traditional mapmakers generally rely on land surveys for information about the territory being mapped. Creators of topographical maps often rely on surveys from the U.S. Geological Survey (USGS). Google Maps are based on satellite images. Some mapmakers credit their sources; some do not. Some indicate trademarks or copyright information. For example, maps at Nationalatlas.gov credit both the USGS and the National Atlas of the United States.