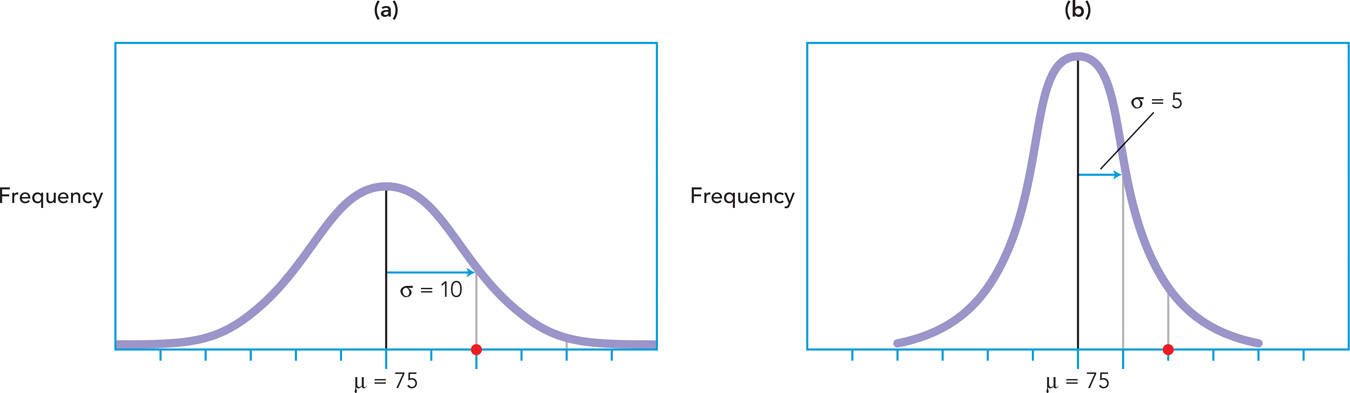
figure A-7 The standard deviation and distance from the mean Here are two distributions of exam scores, each with the same mean of 75, but one with a standard deviation of 10 (a) and one with a standard deviation of 5 (b). If you had gotten an 85 on an exam (red dot on graphs) in which the mean was 75, you would probably prefer that the standard deviation were 5 (b) rather than 10 (a), because then you would have outperformed more of your classmates. You would be 2 standard deviations above the mean rather than 1.