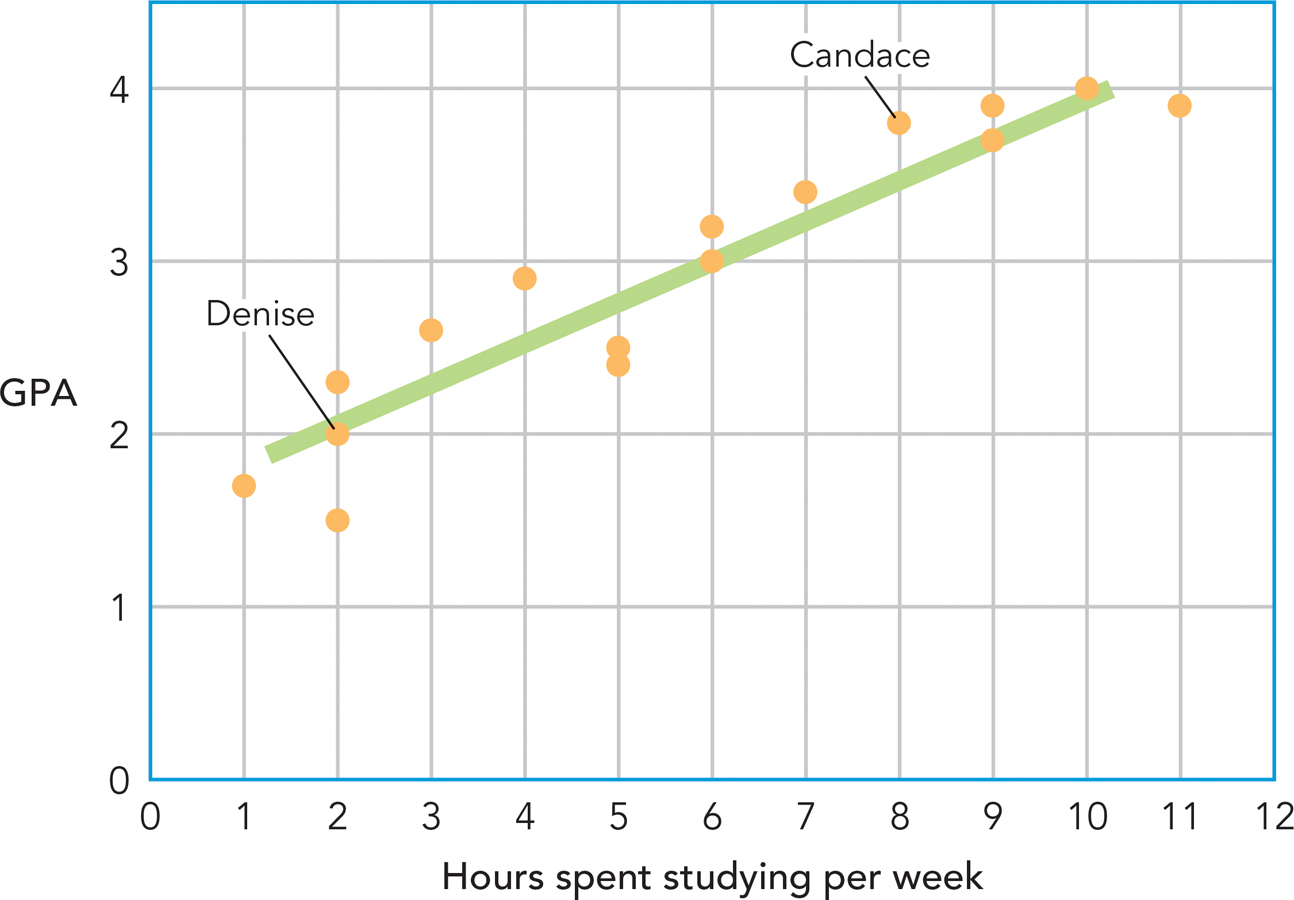
figure A-8 Scatterplot This graph plots the intersection of each individual’s scores for two variables. The fact that these scores do not deviate much from a straight line suggests that there is a linear relationship between these two variables. That is, as a score on one variable changes by 1 unit, so does the score for the other variable.