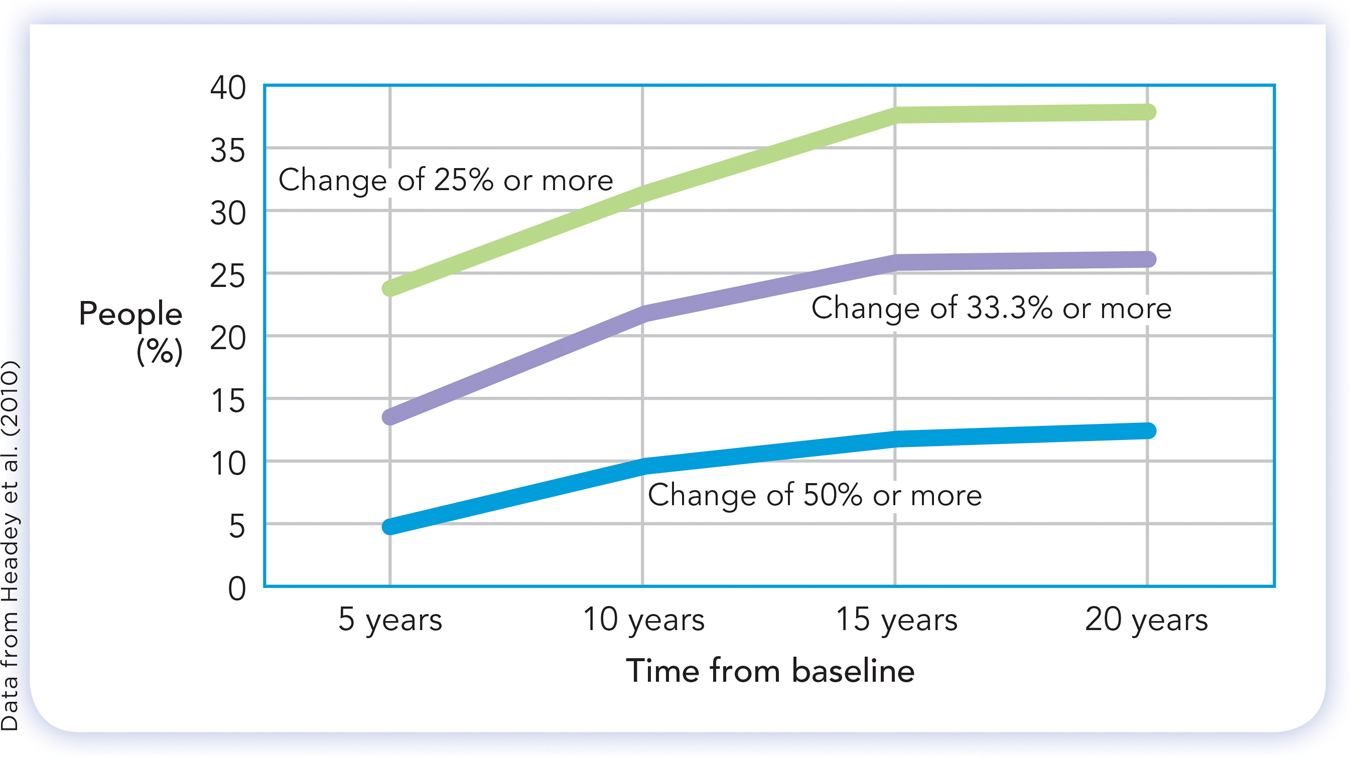
figure 10.10 Change in life satisfaction To find out if people’s satisfaction with life is stable or changes over time, researchers measured life satisfaction over a 20-year period starting in the mid-1980s and at 5-year intervals (Headey, Muffels, & Wagner 2010). At each time point, they determined each person’s life satisfaction percentile, that is, his or her standing compared to others (the average person is at the 50th percentile). The graph shows the percentage of people whose percentile scores changed by 25%, 33.3%, and 50% over time. As you can see, there was a lot of change!