figure 2.7 How to read a graph Quantitative data can be presented concisely in graphs. Here’s a tip for reading them: Read graphs from the outside in. Read the caption and the labels (the outside) first, and only then look at the bars, lines, and other data reports (the inside). If you do this carefully, you often can learn a lot about a study from the graph alone.
Let’s try this with the graph above. From the outside (the caption and the labels) you learn that:
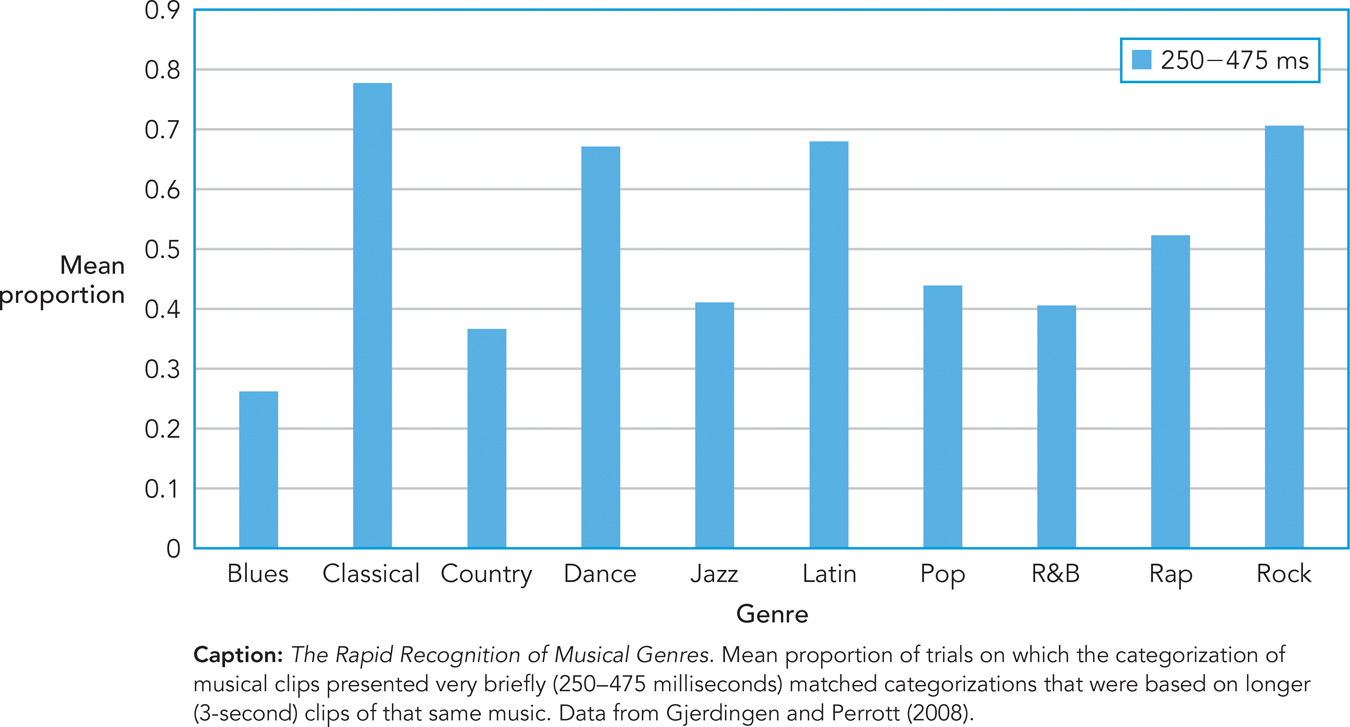
t— blips of sound as brief as a quarter of a second— participants could recognize them. For classical and rock music, a mere quarter- second of sound was sufficient for participants to categorize the music in a manner that matched the categorization of the long clips. People can recognize music quickly! And people can learn a lot from a graph.
Let’s try this with the graph above. From the outside (the caption and the labels) you learn that:
Researchers played clips of pieces of music for (a) a small fraction of a second (25
0– 475 milliseconds) and (b) 3 seconds. The clips represented various musical genres (blues, classical, etc.).
After hearing each clip, participants categorized its genre.
Researchers determined whether participants’ categorizations of the short and long clips of a given piece of music matched.