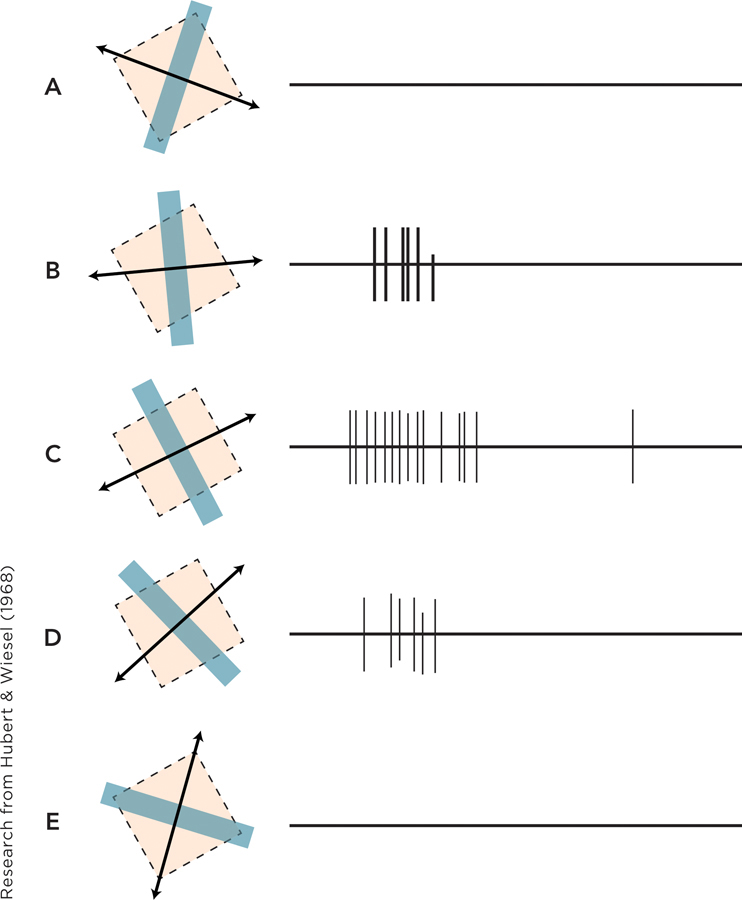
figure 5.34 Hubel and Wiesel line On the left are lines, at different angles, shown to a monkey. On the right is a recording of activity by one cell in that monkey’s visual cortex; the vertical lines indicate activity in the cell. As you can see, the cell responded maximally to a line at a particular angle (the angle in image C).