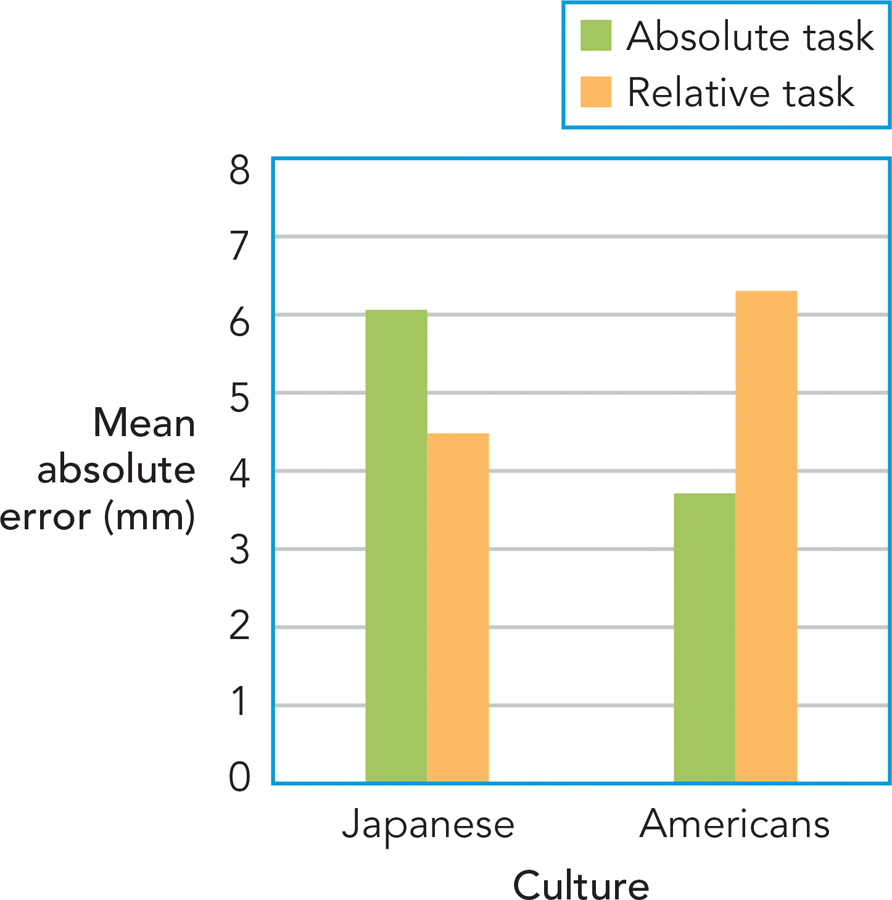
figure 5.8 Cultural variation on a perceptual task The graph shows the average magnitude of error in lines drawn by college students in Japan and in the United States. Japanese students’ errors were smaller (i.e., their performance was better) on the relative length task than on the absolute length task. U.S. students showed the opposite result, performing more accurately on the absolute length task (Kitayama et al., 2003). The results reflect cultural difference in analytic and holistic perception.