2.2 Research Goals and Research Designs
Professionals often begin their work with a design: an outline or sketch of the job to be done. Architects sketch designs for buildings. Fashion designers outline the cut and style of apparel. Psychologists design research. Research designs are plans for the execution of scientific research projects.
When conducting research, psychologists choose designs that achieve specific research goals. Let’s first look at three goals for research, and then examine the research designs that enable psychologists to achieve them.
Research Goals
Preview Question
Question
 What are the three goals of scientific research?
In psychology, or any science, a researcher usually has one of three goals: description, prediction, or causal explanation.
DESCRIPTION. When researchers begin to study a topic, they seek careful, systematic descriptions. Descriptions establish basic facts about the topic under study. These facts, once obtained, guide subsequent theory and research.
As an example, suppose your research topic is social anxiety, which is the tendency to become highly apprehensive, worried, and self-
What percentage of people experience social anxiety?
What are the typical thoughts and feelings of people who experience social anxiety?
How early in life does social anxiety first develop?
These facts alone do not enable you to accomplish much; you cannot tell who is likely to become anxious, or why, or how to help alleviate their anxiety. Nonetheless, descriptive information that answers these questions would provide a foundation for future research.
PREDICTION. When pursuing the second goal, prediction, scientists try to forecast the occurrence of events. They want to know if information available at one point in time can be used to estimate an outcome that occurs later.
When studying something, there are two types of predictions: (1) What predicts its occurrence, and (2) once it occurs, what does it, in turn, predict. We will illustrate with the social anxiety example. Two types of prediction questions are:
What factors predict social anxiety? For example:
Does lower self-
confidence predict higher levels of social anxiety? Does the experience of warm, supportive parenting predict lower levels of social anxiety?
Are people who are biologically similar (e.g., identical twins) likely to have similar levels of social anxiety? (In other words, do biological factors predict social anxiety?)
What outcomes does social anxiety predict?
Do higher levels of social anxiety predict lower levels of professional success?
Do higher levels of social anxiety predict higher levels of courtesy toward others?
Do higher levels of social anxiety in childhood predict higher levels of social anxiety in adulthood? (In other words, are individual differences in social anxiety consistent across years of life?)
CAUSAL EXPLANATION. The third research goal is the ultimate goal of science: explanation (Salmon, 1989). Scientists try to explain why things happen: Why do solids melt at high temperatures? Why do offspring resemble their parents? Why do people experience social anxiety?
To answer why questions, scientists seek causal explanations. Causal explanations identify factors that directly influence outcomes; they show “how an outcome depends on other variables or factors” (Woodward, 2003, p. 6). Consider some possibilities in the case of social anxiety (i.e., where the “outcomes” are people’s varying levels of social anxiety):
Do certain types of thoughts (e.g., “I am going to embarrass myself”) cause people to become socially anxious?
Does training in relaxation skills cause people to experience less social anxiety?
Do antianxiety medications work; that is, do they cause people to have less anxiety? If so, why; that is, what is the cause of their effectiveness?
A key aspect of causal explanation is manipulation. If a factor is manipulated and, as a result, an outcome varies, then the manipulated factor causally influenced the outcome (Woodward, 2003).
Causal explanations are valuable for two reasons. First, they advance the central goal of science: understanding of how the world works. Second, they open the door to practical applications. If you know, for example, that certain types of thoughts cause people to become anxious, then you can apply that knowledge to psychological therapy. Therapists can help people to eliminate those thoughts and replace them with ones that are less anxiety-
Importantly, prediction does not accomplish the goal of causal explanation. If, for instance, on a sunny summer day, you see people living near a beach putting boards over the windows of their homes and businesses, you can make a prediction: There is likely to be a tropical storm or hurricane. The people’s behavior predicts the storm but, of course, does not cause it. (We return to the distinction between prediction and causal explanation later in the chapter, when discussing correlational designs.)
Now that you have learned about the three goals for research, let’s turn to three research designs. The matching number is no coincidence. Each of the three designs—
WHAT DO YOU KNOW?…
Question 3
Match the goal of research on the left with the set of questions that exemplifies it on the right. In this context, we are trying to understand test anxiety.
1. Description 2. Prediction 3. Explanation | “What factors cause test anxiety? If I were to manipulate whether someone succeeded or failed on a test this week, would I observe differences in test anxiety on next week’s test?” “What are the basic facts about test anxiety? For example, what proportion of people experience it?” “What factors forecast test anxiety? For example, if I know how much self- |
Survey Methods
Preview Questions
Question
What is the survey method?
Question
How do samples differ from populations? Why do researchers collect data from samples rather than from whole populations?
Question
Why does random sampling increase the representativeness of a sample?
Researchers often want information about a large group of people. Before a national election, for example, they want to know the political opinions of voters. Getting the information might seem easy enough: Just ask the voters their opinions. But the problem is that there are so many voters. Who has time to talk to all of them?
It turns out that you don’t need to talk to all of them. Instead, you can use the survey method. A survey method is a research design in which researchers obtain descriptive information about a large group of people by getting information from a select subgroup of them (Groves et al., 2009). By selecting the subgroup carefully (as we explain below), one can be confident that the subgroup’s views are similar to those of the group as a whole.
Surveys can be used to collect various types of evidence (Punch, 2003); you could, for instance, survey a subgroup of people and collect biological information (e.g., their height, weight, or blood pressure). In practice, however, most survey research presents people with simple yes/no or multiple-
CULTURAL OPPORTUNITIES
Back Translation
Have you ever seen bad translations—
In a French hotel: Please leave your values at the front desk.
In an elevator in Germany: Do not enter the lift backwards, and only when lit up.
At a dry cleaners in Thailand: Drop your trousers here for best results.
These funny errors highlight a serious issue for psychological research. In today’s psychological science, many researchers conduct studies cross-
A key research method for accomplishing this goal is back translation. Back translation is a method in which research materials—
Back translation cannot solve all the problems encountered when conducting research cross-
WHAT DO YOU KNOW?…
Question 4
What problem is back translation designed to avoid?
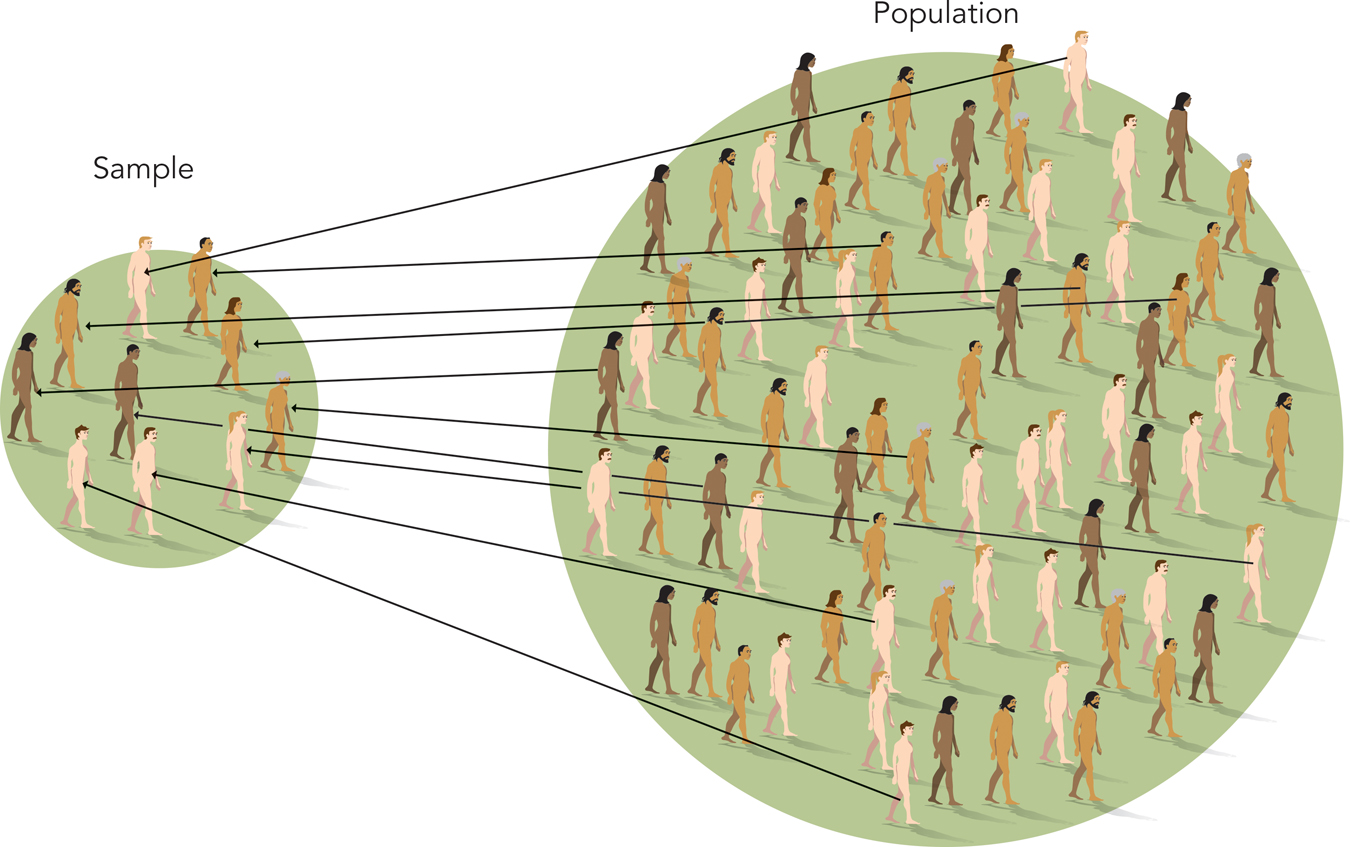
POPULATION AND SAMPLE. When survey researchers conduct a study, the overall, large group of people of interest to them is the study’s population. In our earlier example, the nation’s entire group of eligible voters is the population.
The select subgroup of people contacted by the researcher is called the sample (Figure 2.1). Researchers use information from the sample to draw conclusions about the population as a whole.
In many surveys, the sample is only a small fraction of the population. Nonetheless, information from the sample proves to describe the population accurately. For instance, in presidential elections, pollsters commonly sample only a couple thousand people from a voting population of 125 million. Yet, in the last two elections, the samples predicted the outcomes precisely (Graefe et al., 2013; Panagopoulos, 2009). The key to this precision is the selection of the sample.
RANDOM SAMPLES. How do researchers decide which people from the population go into the sample? Hint: It’s a trick question.
Researchers do not personally decide who goes into a sample. Instead, the sample is chosen randomly. In a random sample, each individual’s presence in (or absence from) the sample is determined by a chance process (similar to flipping a coin or rolling dice). The chance process usually gives every member of the population an equal chance of being in the sample. For instance, to obtain a random sample of 100 of the 5000 students at a college, you would employ a chance process that gives each person a 1-

Random sampling helps researchers obtain a sample that is representative. A representative sample is one whose qualities (gender, ethnicity, income, attitudes, personalities, etc.) match those of the overall population. If, for example, you are surveying students at your college where 13% are Latin American, 12% are African American, and 12% are Asian American, then a representative sample would contain approximately 13% Latin Americans, 12% African Americans, and 12% Asian Americans. A sample that is chosen randomly generally will be representative of the overall population from which it is drawn.
Even a large sample may produce inaccurate results if it is not chosen randomly. Suppose your instructor gives out a course evaluation on a day when 80 of 100 students enrolled in the course are in attendance. The sample is relatively large (80% of the population of 100 students) but is not random. The results thus may misrepresent the opinions of the class as a whole. For instance, the 20 students not in attendance might not like the course as much as the others (maybe that’s why they skipped class), but none of them are in the sample. The sample results thus could be biased; they might overestimate the population’s opinions of the course. The bias could be eliminated by sampling students randomly from the population of 100. (Among its many problems, the dorm study presented earlier failed to sample randomly.)
THINK ABOUT IT
Do people always answer survey questions accurately? How common do you think inaccurate answers are? Here’s a strange fact to consider: In one recent survey conducted in the United States, 1 out of 200 women reported becoming pregnant while being virgins (Herring et al., 2013).
Survey research describes a population at a given point in time, thus achieving the first of the three goals for research. But to achieve the second goal, prediction, one needs a second research strategy: correlational designs.
WHAT DO YOU KNOW?…
Question 5
In survey research, researchers collect information about a large group of people (a ) by selecting a subgroup (a ). Ideally, the researcher selects the subgroup through sampling, to ensure that it is as of the large group as possible.
Correlational Studies
Preview Questions
Question
What is a correlational study?
Question
What scientific goal does a correlational study help psychologists to achieve?
Question
What is a scatterplot and how is it interpreted?
Question
What is a positive correlation? A negative correlation?
Question
What is a correlation coefficient? What are examples of strong and weak positive and negative correlation coefficients?
Question
What is the major limitation of correlational designs?
In a correlational study (or a correlational design), researchers measure two or more quantities and determine whether higher (or lower) levels of one are associated with higher (or lower) levels of another. The measured quantities are called variables. A variable is any property that fluctuates. The property may fluctuate from person to person or from one time to another for any given person (e.g., your mood varies at different times of day). The results of a correlational study indicate the degree to which two or more variables are related.

Correlational studies commonly are conducted with large numbers of people. Researchers measure two or more variables in each individual and then ask whether, in the group as a whole, the variables are correlated. Sometimes the two variables are measured at the same point in time; for example, a researcher might measure people’s current (1) annual income and (2) level of happiness in life to see whether the two are correlated (Diener, Tay, & Oishi, 2013). In other studies, the variables are measured at different time points; for example, researchers have correlated (1) personality qualities measured in childhood with (2) professional and personal success achieved in adulthood (Shiner & Masten, 2012). (Note that, in practice, most correlational studies are not conducted with participants chosen randomly from a large population, as in survey research.)
Psychologists achieve the scientific goal of prediction, discussed earlier, through the use of correlational designs. By measuring two variables, they can determine whether one variable predicts the other. Recall the prediction question “Do higher levels of social anxiety in childhood predict higher levels of social anxiety in adulthood?” When answering this question in a correlational study, the two variables would be:
Variable 1: levels of social anxiety in childhood
Variable 2: levels of social anxiety in adulthood
A researcher would measure social anxiety in a group of children and then measure social anxiety again in those same people when they reach adulthood. At that point, the research would determine whether the two variables are related, that is, if Variable 1 predicts Variable 2.

Now the question is how, exactly, to determine whether two variables are related. One option is to draw a graph. A scatterplot is a graph that displays the relation between two variables. Data points representing the measurements of the two variables “scatter” about the visual display.
Figure 2.2 shows a scatterplot for two variables: amount of rainfall and percentage of people using umbrellas. In this hypothetical study, a researcher measured both variables on each of 20 days. Each point represents the measurement of the two variables on a given day.
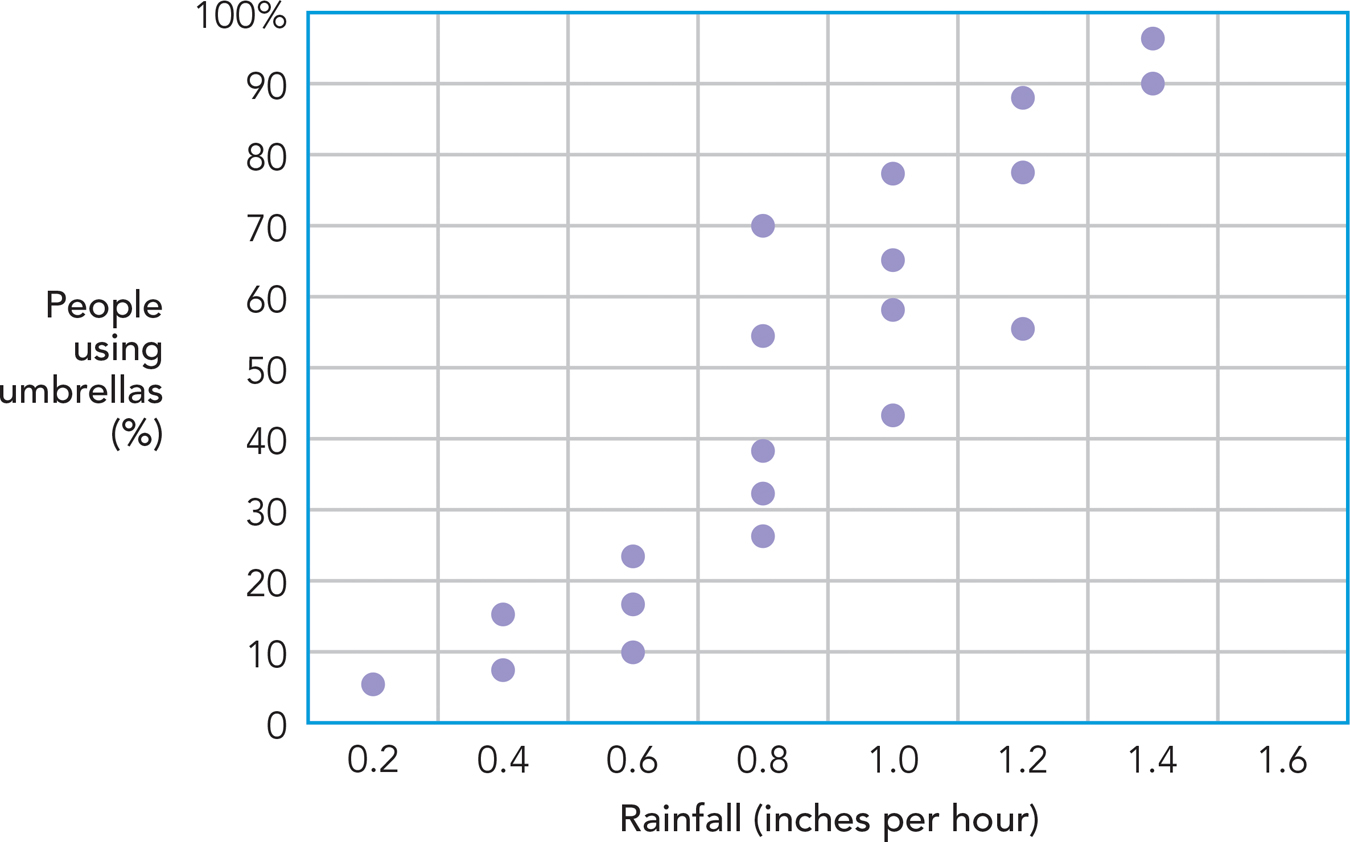
POSITIVE AND NEGATIVE CORRELATIONS. If you look at the graph (Figure 2.2), the results are clear. When there’s more rain, more people use umbrellas. This type of relation, in which higher levels of one variable co-
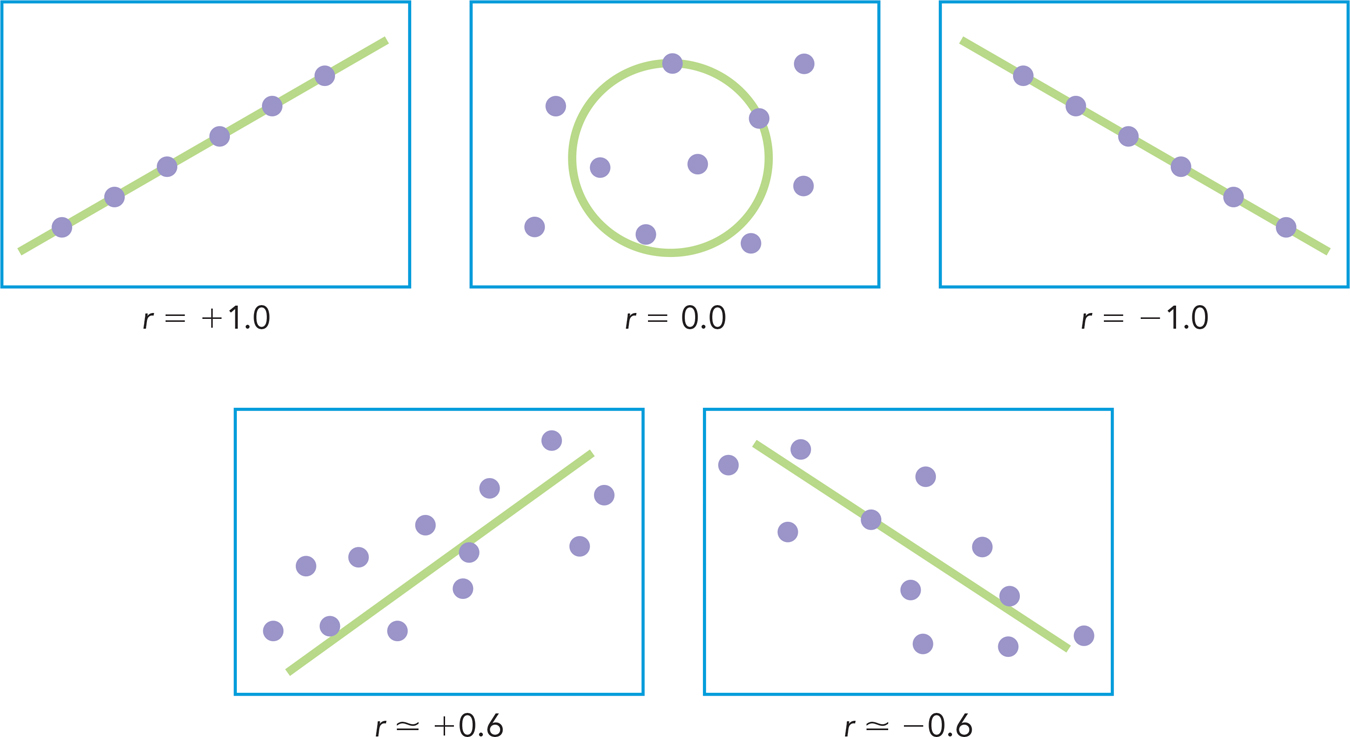
The second option for determining whether two variables are related is to compute a number that summarizes the relation between them. The correlation coefficient (or simply correlation) is a numerical value that represents the strength of the relation between any two variables. It usually is symbolized with the letter r. The correlation is based on a formula (which can be found in this book’s Statistics Appendix) that limits the minimum and maximum correlation to −1.0 and +1.0. Correlations above zero are called positive correlations and those below zero are called negative correlations. Let’s illustrate what these numbers mean using some examples:
A correlation of zero (r = .00) indicates that two variables don’t go together at all. Higher levels of one are not systematically associated with either higher or lower levels of the other. For example, the correlation between (1) performance on skilled technical jobs (e.g., technician, accountant, computer programmer) and (2) the personality trait of extroversion is zero (Hurtz & Donovan, 2000). The personality trait refers to outgoing social behaviors that have nothing to do with technical skills.
Strong positive correlations (i.e., near +1.0) indicate that high levels of one variable frequently co-
occur with high levels of the other. For example, in one study the correlation between (1) perceived self- efficacy (i.e., confidence in one’s abilities) and (2) behavior (specifically, the ability to behave effectively in situations that create a lot of fear) was +.84. Higher levels of self- efficacy were associated with higher levels of effective behavior (Bandura, Adams, & Beyer, 1977). Strong negative correlations (i.e., near −1.0) indicate that high levels of one variable frequently co-
occur with low levels of the other. For example, when researchers correlated (1) the degree of unacceptable delays in customer service (e.g., delays occurring because “the employees are all sending text messages to their friends”) with (2) people’s liking of stores, the correlation was −.73 (Houston, Bettencourt, & Wenger, 1998). More unacceptable delays co- occurred with less liking.
Figure 2.3 displays some scatterplots and the correlation coefficients associated with each. In our rainfall and umbrellas example from Figure 2.2, the correlation is +.91. That number confirms the impression you got from the graph: Precipitation and umbrella use are strongly positively correlated.
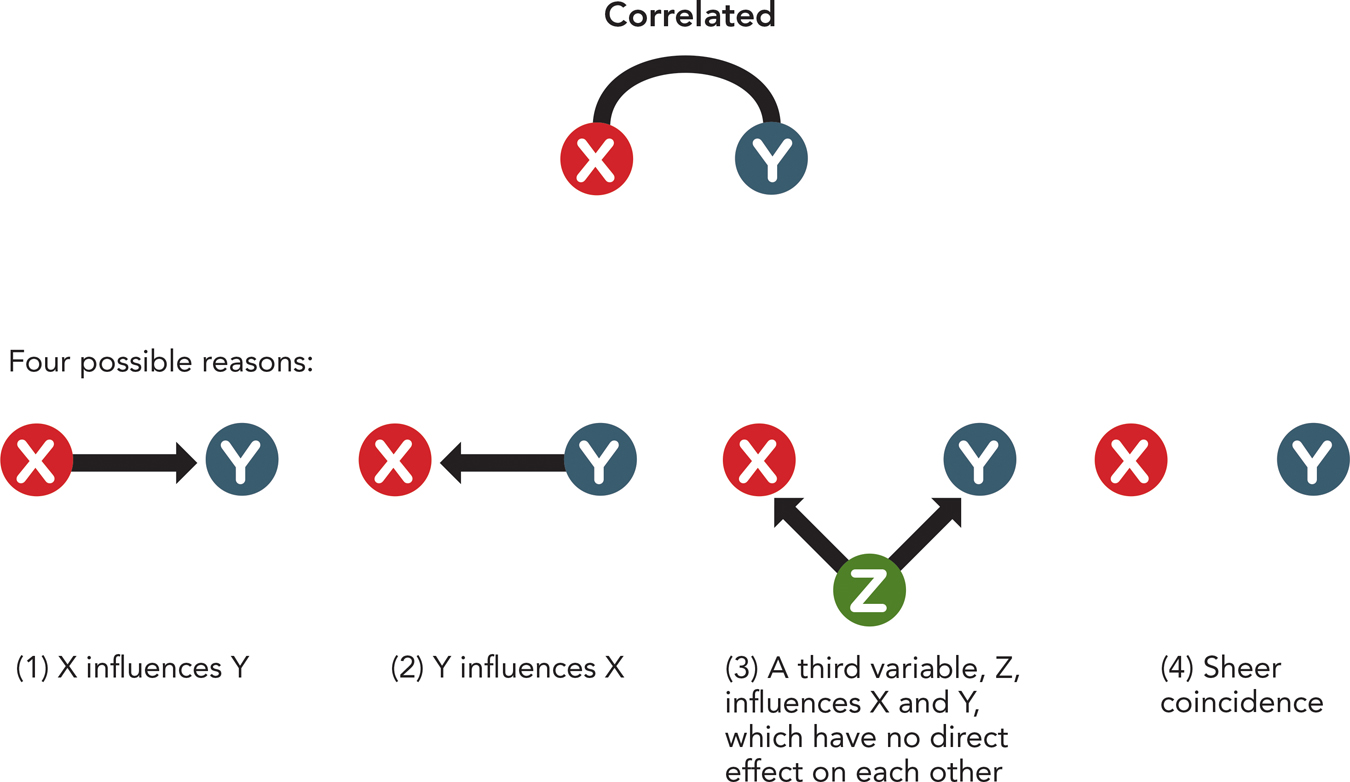
CORRELATION … AND CAUSATION? Does a positive correlation between two variables prove that one variable caused the other? No. In fact, “No, no, a thousand times no.” There could be other reasons for the correlation—
In California, the average amount of rainfall in a given month correlates positively with the number of letters in the name of the month (Figure 2.4). Short-
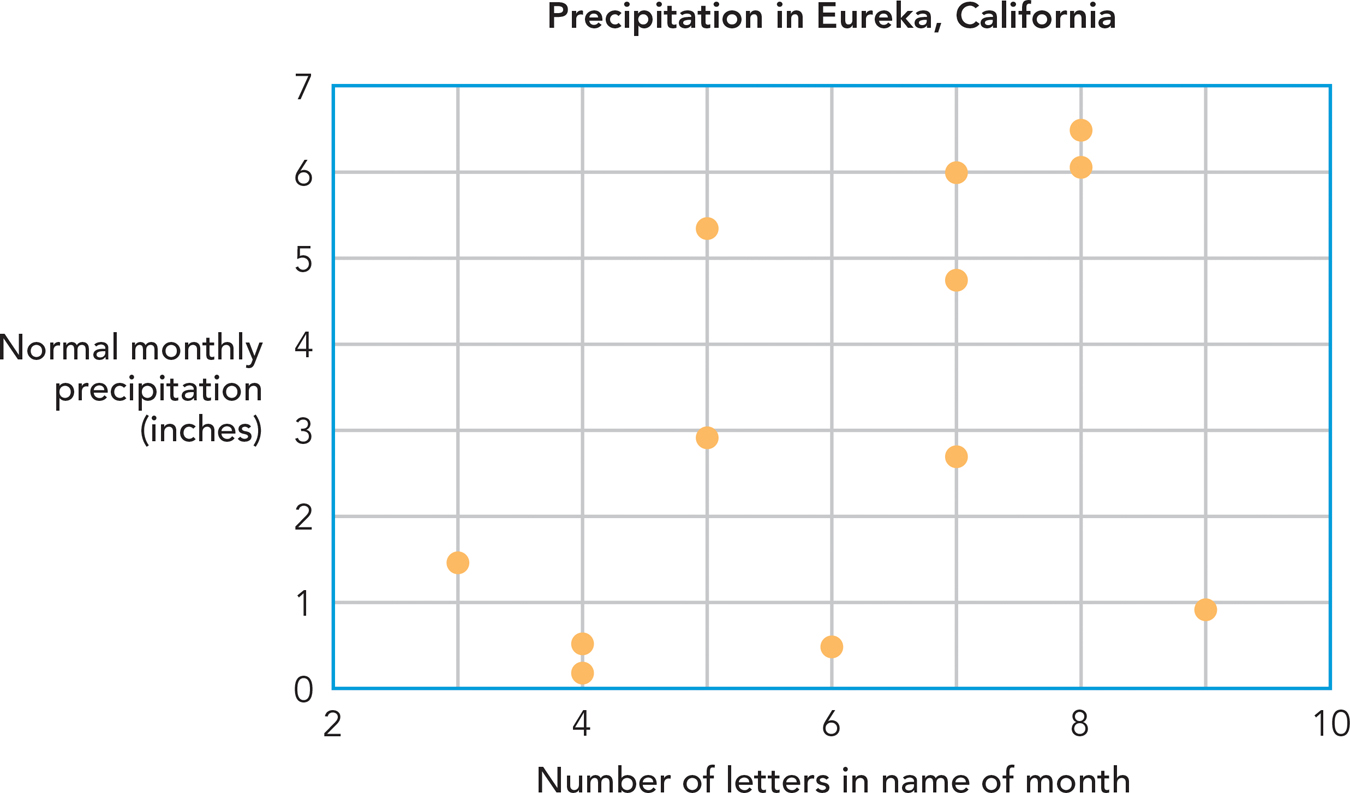
In our example, the conclusion is obvious; names of months can’t cause rainfall. But often the question of causality is trickier. Consider these two examples:
Levels of poverty are positively correlated with rates of mental illness. Does poverty, however, cause mental illness? The question is difficult to answer, and it remains a point of debate (Sen, 2012). It is possible that the causal relationship runs in the opposite direction; mental illness would cause poverty if people with severe mental illness are less able to get good jobs.
Higher levels of education are positively correlated with levels of wealth in adulthood. Does that mean education causes greater wealth? Maybe not. Perhaps wealthy families send their children to school for longer and pass on their wealth to these children through inheritance, with education having no causal effect on wealth in adulthood.
In general, when two variables X and Y are correlated, there are four possibilities: (1) X causes Y; (2) Y causes X; (3) some third variable affects both X and Y, and thus neither X nor Y is a cause; (4) the relation between X and Y is sheer coincidence (Figure 2.5). A correlational research design can’t distinguish one possibility from another. For this, one needs an experiment.
WHAT DO YOU KNOW?…
Question 6
For the following two relationships, determine whether the correlation coefficient would be positive or negative.
Hours spent studying for an exam and scores on that exam
A. B. Speed of travel and time it takes to arrive at a destination
A. B.
Question 7
For which of the following relationships would the correlation coefficient be closest to zero?
| A. |
| B. |
| C. |
Question 8
An online news outlet reported the headline “Intelligent Children More Likely to Become Vegetarian” (“Intelligent Children,” 2006). Assume this correlation is not a mere coincidence and identify a third variable that could simultaneously affect intelligence levels and the incidence of vegetarianism.
Experimental Designs
Preview Questions
Question
What scientific goal is achieved through experimental designs?
Question
How does an independent variable differ from a dependent variable?
Question
What is a hypothesis?
Question
What is a control group?
Question
What are the two defining characteristics of an experiment?
Question
How does random assignment enable researchers to establish a causal effect between independent and dependent variables?
When psychologists want to identify the causes of events, they conduct experiments. In everyday language, to “experiment” means to try something new. In psychology, however, the word has a more specific meaning. An experiment is a research design in which a variable is manipulated.
Earlier, we said that manipulation is key to causal explanation (Woodward, 2003). Experiments, which manipulate variables, thus are the psychologist’s tool for achieving the goal of causal explanation.
In experiments, a researcher manipulates one or more variables to determine whether the manipulation affects other variables. The researcher’s plan for manipulating variables is the experimental design.
EXPERIMENTAL DESIGN BASICS. In the terminology of experimental design, there are two types of variables: independent and dependent variables. It’s important to remember which is which:
Independent variable: Any variable that the experimenter manipulates is called an independent variable. If, for example, an experimenter studying memory gives some people one minute to memorize a list of words and gives other people two minutes, the manipulated variable, amount of time, is the independent variable.
Dependent variable: The variable that is potentially influenced by the manipulated independent variable is called the dependent variable. Psychologists measure the dependent variable to see whether it was affected by the independent variable. In our memory example above, the experimenter would give people a memory test and measure the number of words they remember. The number of words remembered would be the dependent variable. The term dependent means that the level of this variable may be influenced by—
or may “depend” on— the independent variable.
To manipulate the independent variable, the researcher creates different settings in which the dependent variable is observed. The settings are identical in all ways but one: the level of the independent variable changes. These different settings, which contain different levels of the independent variable, are called the study’s experimental conditions. Memorization times of one minute and two minutes, in our example above, would be that study’s two experimental conditions. (Table 2.1 summarizes the three research goals and three research designs we have discussed.)
2.1
| Research Goals and Research Designs | |
|---|---|
|
Research Goal |
Research Design |
|
Description: Establish basic facts about the topic under study. |
Survey method: Use information from a sample to describe the characteristics of a population. |
|
Prediction: Forecast the occurrence of events. |
Correlational study: Determine the degree to which one variable predicts another variable. |
|
Causal explanation: Identify factors that directly influence outcomes. |
Experimental design: Manipulate independent variables to determine their causal impact on a dependent variable. |
The purpose of an experiment usually is to test a hypothesis. A hypothesis is a prediction about the result of a study. In our example, the researcher might predict that the number of words remembered will be higher in the two-
Many experiments contain one experimental condition that receives a special name: the control group. A control group is an experimental condition that eliminates the factor or factors that vary in the other experimental conditions. In other words, the control group brings the level of the independent variable down to zero: It eliminates it.
That was a lot of terminology: independent variable, dependent variable, experimental conditions, hypothesis, control group. Let’s make these terms concrete with another example. Imagine you are interested in therapies for depression. In particular, you think that the frequency of therapy sessions (or the “intensity” of therapy; Moos & Moos, 2003) influences therapy’s effectiveness; you expect that more frequent meetings will increase effectiveness. To test your idea, you plan a study in which different people receive therapy at different frequencies—
The idea that more frequent sessions increase therapy effectiveness is your hypothesis.
The frequency of meetings is your independent variable.
Each level of frequency (one, two, or three times per week) is an experimental condition.
The different experimental conditions manipulate the independent variable, frequency of meetings.
A measure of depression would be your dependent variable.
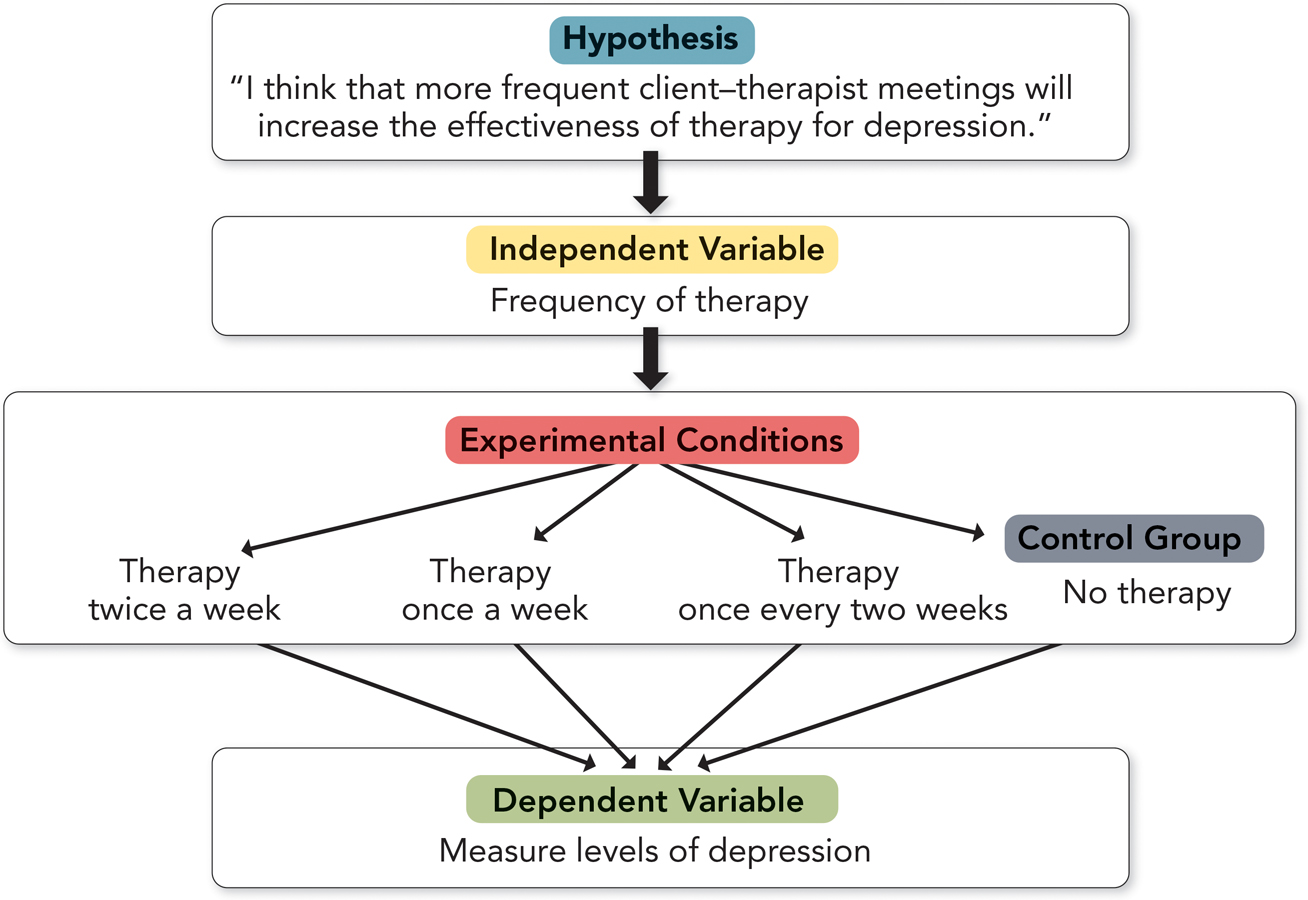
If you are tracking the details, you’re now asking, “What about the control group?” As a control group, you could create a fourth condition in which the level of the independent variable is brought down to zero: People receive no therapy. To see its value, imagine that you had run only the other three conditions and people in all three had displayed similar levels of depression at the end of therapy. What could you conclude? Maybe all three therapies were very effective, but to the same degree. Or maybe none of the three therapies worked at all. Without the control group, there is no way of knowing. But with the control group, you can see whether therapy, in general, had any effect.
THE POWER OF RANDOM ASSIGNMENT. Suppose you did conduct the depression study we just described. How would you decide which participant is assigned to which condition?
The answer is the same as that for random sampling: You wouldn’t decide. Nobody would decide. Each participant would be allocated to an experimental condition through a random procedure. Random assignment is a process in which participants are allocated to conditions of an experiment on an entirely chance basis.
An experiment, then, has two defining characteristics: (1) more than one experimental condition, and (2) the random assignment of research participants to experimental conditions.
Random assignment serves a critical function. It reduces the possibility of a potential experimental confound, a factor other than the independent variable that might create differences between experimental conditions. One potential confound is differences between people. If different types of people are assigned to the different conditions of an experiment, one cannot determine the true cause of differences between the conditions, which may have resulted from (a) the experimental conditions or (b) the people assigned to the experimental conditions (see Research Toolkit). Random assignment solves this problem. It assures that, on average, the characteristics of the people assigned to the different conditions of an experiment will not differ at the outset of the study.
To see how this works, imagine running an experiment on memory with three experimental conditions and 90 participants. Some of the 90 might have exceptionally good memory and others might have unusually poor memory. Will these differences between people affect your results? If you use random assignment, they probably won’t. By chance—
RESEARCH TOOLKIT
Truly Random Assignment
You’ve learned that a key tool in the research psychologist’s toolkit is random assignment. Let’s examine it more closely.
In everyday language, random means “haphazard.” But in science, its meaning is different. When researchers assign research participants to conditions of an experiment, they do not do so haphazardly. They use a formal procedure. A coin flip, a roll of dice, or a table of random numbers specifies the conditions to which each participant is assigned.
“Does this make any difference?” you might be asking. “Couldn’t one just assign participants haphazardly?” As it turns out, yes, it makes a difference. A rare case of failing to assign participants randomly shows how much of a difference it can make.
A researcher wanted to study the stress of decision making—
“Executive monkey” condition: Monkeys decided whether, and when, to press a lever placed in front them. If they didn’t press it within 20 seconds, the monkeys received a brief electric shock.
Control condition: Monkeys did not make decisions. Although a lever was placed in front of them, it was inactive; it didn’t affect the occurrence of shocks. However, whenever an executive monkey (i.e., a monkey in the “executive monkey” condition) received a shock as a result of failing to press the lever, a control-
group monkey got shocked, too. The two groups thus received the same amount of shock.
What happened? Bad news for the executive monkeys: After a few weeks on the job, they developed gastrointestinal ulcers and died. The researchers concluded that the stress of deciding when to press the lever impaired their health. But good news for the control group: Despite receiving the same number of shocks as the executive monkeys, no control-
Subsequently, more researchers studied the impact of having control over stress. Time and time again, they obtained findings opposite to the executive monkeys study: Not having control increased stress and impaired health (Lefcourt, 1973). A recent study of real-
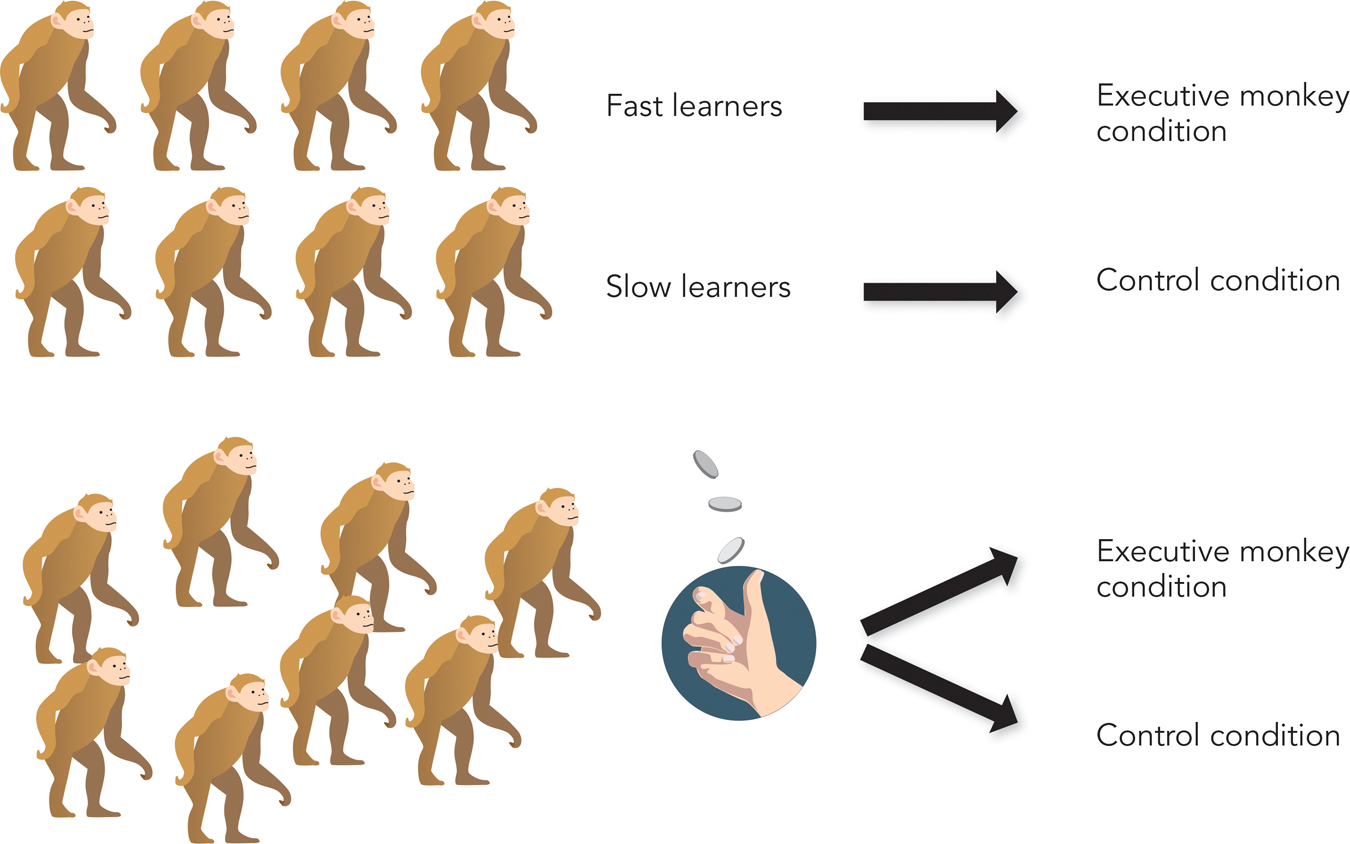
Why were the original executive monkey results so unusual? The researchers neglected random assignment. They assigned to the “executive monkey” condition those monkeys who had learned the lever-
Today, essentially all researchers assign participants to conditions randomly. In the annals of psychology, the research-
WHAT DO YOU KNOW?…
Question 9
The following statement is incorrect. Explain why: “Random assignment increases the chances that any observed differences between experimental and control conditions are due to preexisting differences rather than to the manipulation of variables.”
Now that you have learned about random assignment and the elimination of confounds, you can answer the question in this chapter’s opening story. Recall that men walking on a frightening, physically arousing bridge showed more sexual attraction toward a woman than did men walking on a safe, solid bridge. Yet the researchers did not find the results to be convincing. Why not? They knew their study lacked random assignment and thus might have a confound. The men had not been randomly assigned to one bridge or the other; they had personally chosen to walk across a particular bridge. As a result, the variable (type of bridge) may have been confounded with men’s personality styles. For example, men who opted for the frightening bridge may have been more bold, adventurous, and thrill-
WHAT DO YOU KNOW?…
Question 10
Suppose you wanted to test whether studying a little bit at a time over several days would lead to better test performance than cramming the night before. Match each of the components of such a study with its correct label in the list below.
1. Method for controlling for preexisting differences, such as test- 2. Third condition that receives no instruction on how to study 3. Study instructions (study a little bit at a time vs. cram all at once) 4. Uncontrolled variable, such as test- 5. “Studying a little bit at a time will lead to better test performance than cramming.” 6. Test performance | Hypothesis Dependent variable Control group Random assignment Independent variable Confound |