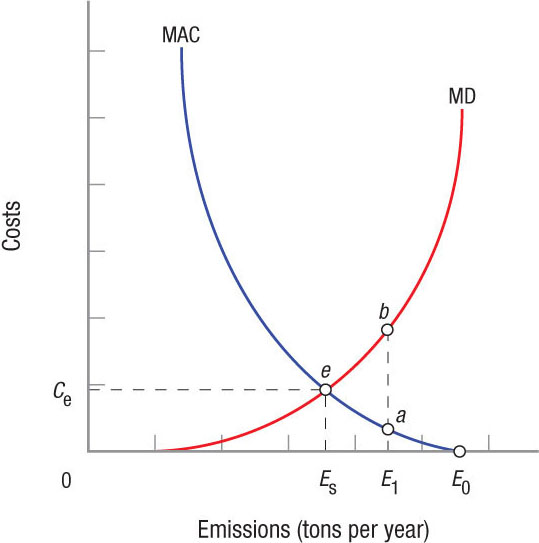
Marginal Damages and Marginal Abatement Costs The marginal damage curve (MD) shows the change in damages that come from a given change in emission levels. The horizontal axis measures pollution. Note that E0 is the maximum pollution that can occur without environmental cleanup. The vertical axis measures the environmental costs of this pollution. Marginal abatement costs curve (MAC) begins at zero at E0, then rises as emission levels are reduced (moving leftward from E0). Socially optimal pollution is ES, at a cost to society of Ce (point e).