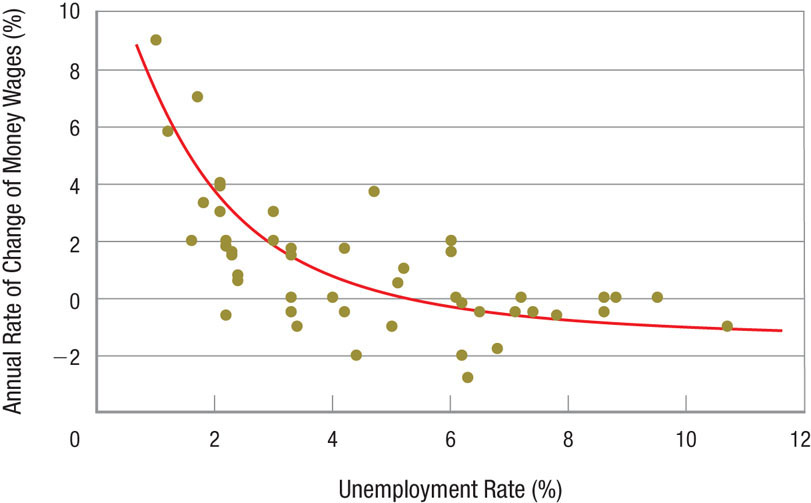
FIGURE 2
The Original Phillips Curve for Britain (1861–1957) A. W. Phillips compared the rate of change in money wages to unemployment rates in Britain from 1861 to 1957. The resulting nonlinear, negatively sloped curve is the first example of a Phillips curve. When unemployment rises, wage rates fall, and vice versa. Note that some dots represent multiple years.
[Leave] [Close]