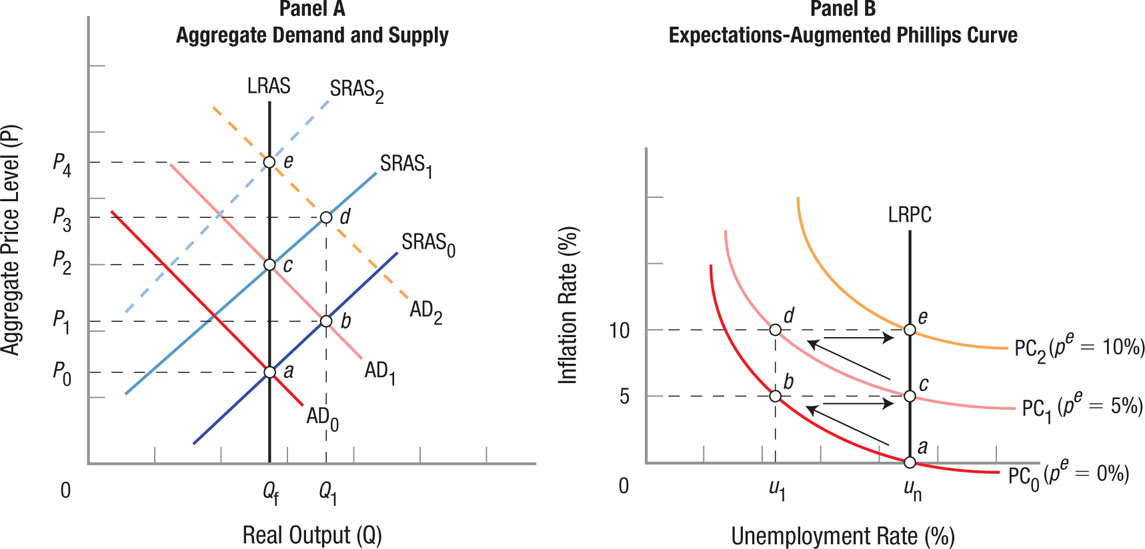
FIGURE 6
Aggregate Demand, Aggregate Supply, and the Expectations-Augmented Phillips Curve Panel A shows the economy’s aggregate demand and supply curves, and panel B shows the economy’s Phillips curve, augmented by inflationary expectations. Using expansionary policies to reduce unemployment below un, policymakers shift aggregate demand in panel A from AD0 to AD1. This moves the economy to point b, with real output and the price level rising to Q1 and P1. Unemployment declines to u1 (point b in panel B), but inflation rises to something approaching 5%. If policymakers attempt to hold unemployment below the natural rate, the economy will endure accelerating inflation. The long-run Phillips curve (LRPC) in panel B shows the relationship between inflation and unemployment when the inflation rate is just equal to inflationary expectations.
[Leave] [Close]