Production Possibilities and Economic Growth
As we discovered in the previous section, all countries and all economies face constraints on their production capabilities. Production can be limited by the quantity of the various factors of production in the country and its current technology. Technology includes such considerations as the country’s infrastructure, its transportation and education systems, and the economic freedom it allows. Although perhaps going beyond the everyday meaning of the word technology, for simplicity, we will assume that all of these factors help determine the state of a country’s technology.
To further simplify matters, production possibilities analysis assumes that the quantity of resources available and the technology of the economy remain constant, and that the economy produces only two products. Although a two-product world sounds far-fetched, this simplification allows us to analyze many important concepts regarding production and tradeoffs. Further, the conclusions drawn from this simple model will not differ fundamentally from a more complex model of the real world.
Production Possibilities
Assume that our simple economy produces backpacks and tablet computers. Figure 2 with its accompanying table shows the production possibilities frontier for this economy. The table shows seven possible production levels (a–g). These seven possibilities, which range from 12,000 backpacks and zero tablets to zero backpacks and 6,000 tablets, are graphed in Figure 2.
FIGURE 2
Production Possibilities Frontier Using all of its resources, this stylized economy can produce many different mixes of backpacks and tablets. Production levels on, or to the left of, the resulting PPF are attainable for this economy. Production levels to the right of the PPF are unattainable.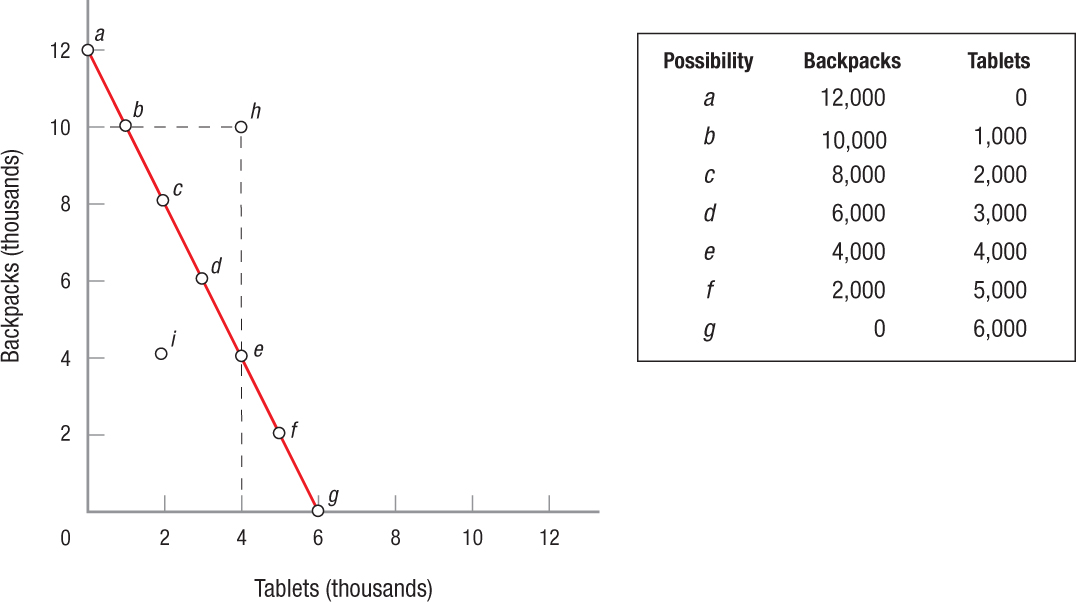
production possibilities frontier (PPF) Shows the combinations of two goods that are possible for a society to produce at full employment. Points on or inside the PPF are attainable, and those outside of the frontier are unattainable.
When we connect the seven production possibilities, we delineate the production possibilities frontier (PPF) for this economy (some economists refer to this curve as the production possibilities curve). All points on the PPF are considered attainable by our economy. Everything to the left of the PPF is also attainable, but is an inefficient use of resources—the economy can always do better. Everything to the right of the curve is considered unattainable. Therefore, the PPF maps out the economy’s limits; it is impossible for the economy to produce at levels beyond the PPF without an increase in resources or technology.
What the PPF in Figure 2 shows is that, given an efficient use of limited resources and taking technology into account, this economy can produce any of the seven combinations of tablets and backpacks listed, each of which represents a point of maximum output for the economy. If society wants to produce 1,000 tablets, it will only be able to produce 10,000 backpacks, as shown by point b on the PPF. Should the society decide that mobile Internet access is important, it might decide to produce 4,000 tablets, which would force it to cut backpack production down to 4,000, shown by point e. At each of these points, resources are fully employed in the economy, and therefore increasing production of one good requires giving up some production of the other. Also, the economy can produce any combination of the two products on or within the PPF, but not any combinations beyond it.
Contrast points c and e with production at point i. At point i the economy is only producing 2,000 tablets and 4,000 backpacks. Clearly, some resources are not being used. When fully employed, the economy’s resources could produce more of both goods (point d).
Because the PPF represents a maximum output, the economy could not produce 4,000 tablets and still produce 10,000 backpacks. This situation, shown by point h, lies to the right of the PPF and hence outside the realm of possibility. Anything to the right of the PPF is impossible for our economy to attain.
opportunity cost The cost paid for one product in terms of the output (or consumption) of another product that must be forgone.
Opportunity Cost Whenever a country reallocates resources to change production patterns, it does so at a price. This price is called opportunity cost. Recall from Chapter 1 that opportunity cost is what you give up when making an economic decision. Here society is deciding how many backpacks and tablets to produce. If society decides to produce more tablets, it gives up the ability to produce more backpacks. Shown through the PPF, the opportunity cost of producing more of one good is determined by the amount of the other good that is given up. In moving from point b to point e in Figure 2, tablet production increases by 3,000 units, from 1,000 units to 4,000 units. In contrast, the country must forgo producing 6,000 backpacks because production falls from 10,000 backpacks to 4,000 backpacks. Giving up 6,000 backpacks for 3,000 more tablets represents an opportunity cost of 6,000 backpacks for these 3,000 tablets, or two backpacks for each tablet.
Opportunity cost thus represents the tradeoff required when an economy wants to increase its production of any single product. Governments must choose between guns and butter, or between military spending and social spending. Since there are limits to what taxpayers are willing to pay, spending choices are necessary. Think of opportunity costs as what you or the economy must give up to have more of a product or service.
Increasing Opportunity Costs In most cases, land, labor, and capital cannot easily be shifted from producing one good or service to another. You cannot take a semitrailer and use it to plow a field, even though the semi and a top-of-the-line tractor cost about the same. The fact is that some resources are suited to specific sorts of production, just as some people seem to be better suited to performing one activity over another. Some people have a talent for music or art, and they would be miserable—and inefficient—working as accountants or computer programmers. Some people find they are more comfortable working outside, while others require the amenities of an environmentally controlled, ergonomically designed office.
Thus, a more realistic production possibilities frontier is shown in Figure 3. This PPF is concave to (or bowed away from) the origin, because opportunity costs rise as more factors are used to produce increasing quantities of one product. Another way of saying this is that resources are subject to diminishing returns as more resources are devoted to the production of one product. Let’s consider why this is so.
FIGURE 3
Production Possibilities Frontier (Increasing Opportunity Costs) This figure shows a more realistic production possibilities frontier for an economy. This PPF is bowed out from the origin since opportunity costs rise as more factors are used to produce increasing quantities of one product or the other.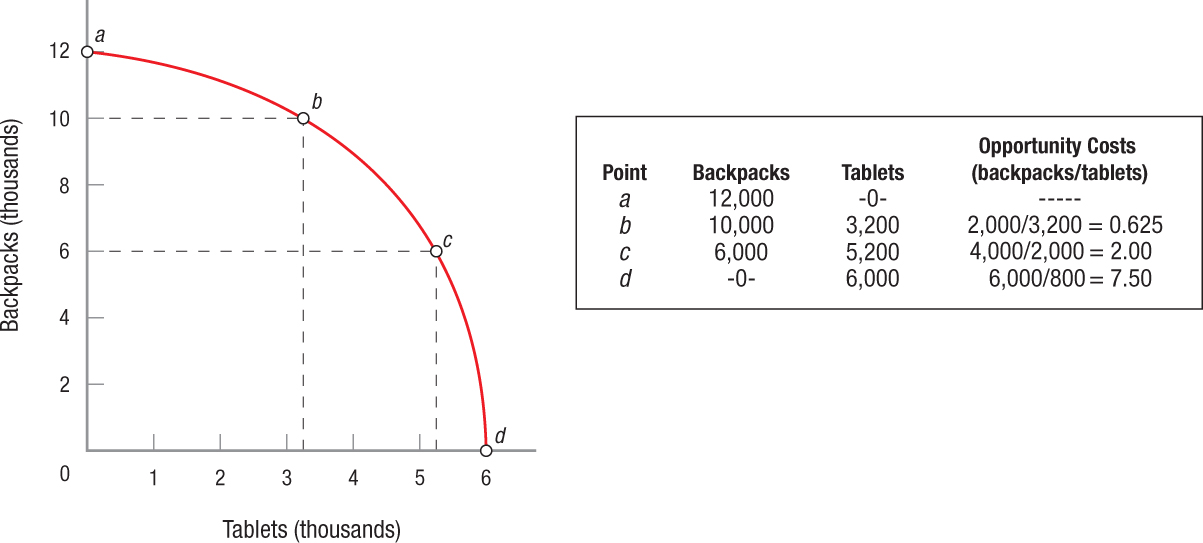

Let’s begin at a point at which the economy’s resources are strictly devoted to backpack production (point a). Now assume that society decides to produce 3,200 tablets. This will require a move from point a to point b. As we can see, 2,000 backpacks must be given up to get the added 3,200 tablets. This means the opportunity cost of 1 tablet is 0.625 backpacks (2,000 ÷ 3,200 = 0.625). This is a low opportunity cost, because those resources that are better suited to producing tablets will be the first ones shifted into this industry.
But what happens when this society decides to produce an additional 2,000 tablets, or moves from point b to point c on the graph? As Figure 3 illustrates, each additional tablet costs 2 backpacks because producing 2,000 more tablets requires the society to sacrifice 4,000 backpacks. Thus, the opportunity cost of tablets has more than tripled due to diminishing returns on the tablet side, which arise from the unsuitability of these new resources as more resources are shifted to tablets.
To describe what has happened in plain terms, when the economy was producing 12,000 backpacks, all its resources went into backpack production. Those members of the labor force who are engineers and electronic assemblers were probably not well suited to producing backpacks. As the economy reduces backpack production to start producing tablets, the opportunity cost of tablets was low, because the resources first shifted, including workers, were likely to be the ones most suited to tablet production and least suited to backpack manufacture. Eventually, however, as tablets became the dominant product, manufacturing more tablets required shifting workers skilled in backpack production to the tablet industry. Employing these less suitable resources drives up the opportunity costs of tablets.
You may be wondering which point along the PPF is the best for society. Economists have no grounds for stating unequivocally which mixture of goods and services would be ideal. The perfect mixture of goods depends on the tastes and preferences of the members of society. In a capitalist economy, resource allocation is determined largely by individual choices and the workings of private markets. We consider these markets and their operations in the next chapter.
Economic Growth
We have seen that PPFs map out the maximum that an economy can produce: Points to the right of the PPF are unattainable. But what if the PPF can be shifted to the right? This shift would give economies new maximum frontiers. In fact, we will see that economic growth can be viewed as a shift in the PPF outward. In this section, we use the production possibilities model to determine some of the major reasons for economic growth. Understanding these reasons for growth will enable us to suggest some broad economic policies that could lead to expanded growth.
The production possibilities model holds resources and technology constant to derive the PPF. These assumptions suggest that economic growth has two basic determinants: expanding resources and improving technologies. The expansion of resources allows producers to increase their production of all goods and services in an economy. Specific technological improvements, however, often affect only one industry directly. The development of a new color printing process, for instance, will directly affect only the printing industry.
Nevertheless, the ripples from technological improvements can spread out through an entire economy, just like ripples in a pond. Specifically, improvements in technology can lead to new products, improved goods and services, and increased productivity.
Sometimes technological improvements in one industry allow other industries to increase their production with existing resources. This means producers can increase output without using added labor or other resources. Alternatively, they can get the same production levels as before by using fewer resources than before. This frees up resources in the economy for use in other industries.
When the electric lightbulb was invented, it not only created a new industry (someone had to produce lightbulbs), but it also revolutionized other industries. Factories could stay open longer since they no longer had to rely on the sun for light. Workers could see better, thus improving the quality of their work. The result was that resources operated more efficiently throughout the entire economy.
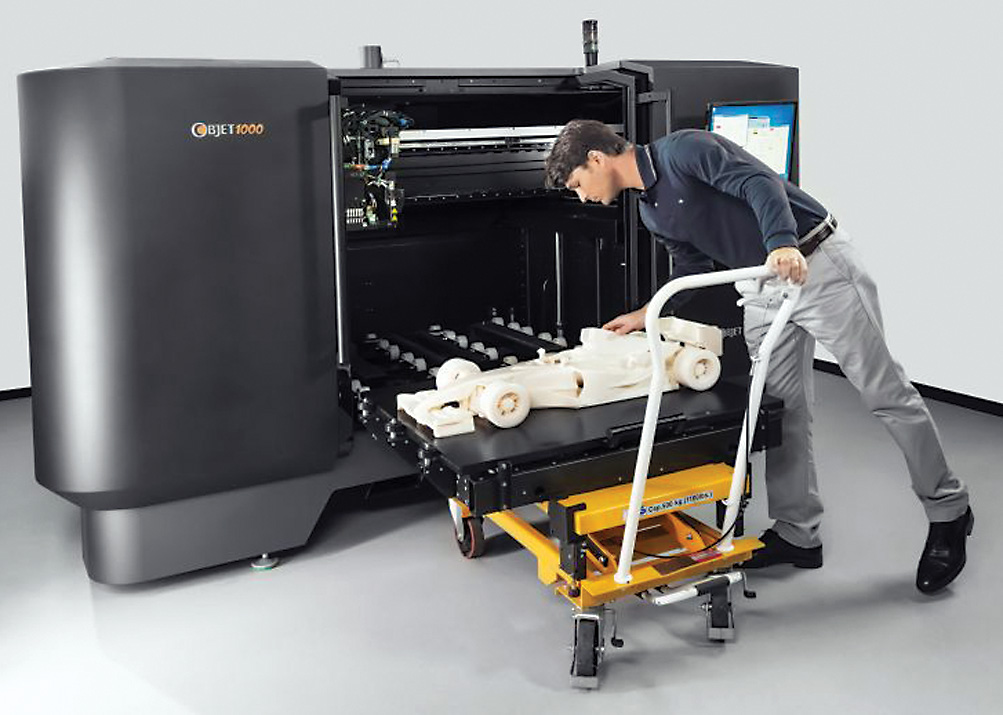
The modern-day equivalent of the lightbulb might be the smartphone. Widespread use of these mobile devices enables people all across the world to produce goods and services more efficiently. Insurance agents can file claims instantly from disaster sites, deals can be closed while one is stuck in traffic, and communications have been revolutionized. Thus, this new technology has ultimately expanded time, the most finite of our resources. A similar argument could be made for the Internet. It has profoundly changed how many products are bought, sold, and delivered, and has expanded communications and the flow of information.
Expanding Resources The PPF represents the constraints on an economy at a specific time. But economies are constantly changing, and so are PPFs. Capital and labor are the principal resources that can be changed through government action. Land and entrepreneurial talent are important factors of production, but neither is easy to change by government policies. The government can make owning a business easier or more profitable by reducing regulations, or by offering low-interest loans or favorable tax treatment to small businesses. However, it is difficult to turn people into risk takers through government policy.
Increasing Labor and Human Capital A clear increase in population, the number of households, or the size of the labor force shifts the PPF outward, as shown in Figure 4. With added labor, the production possibilities available to the economy expand from PPF0 to PPF1. Such a labor increase can be caused by higher birthrates, increased immigration, or an increased willingness of people to enter the labor force. This last type of increase has occurred over the past several decades as more women have entered the labor force on a permanent basis. America’s high level of immigration (both legal and illegal) fuels a strong rate of economic growth.
FIGURE 4
Economic Growth by Expanding Resources A clear increase in population, the number of households, or the size of the labor force shifts the PPF outward. In this figure, a rising supply of labor expands the economy’s production possibilities from PPF0 to PPF1.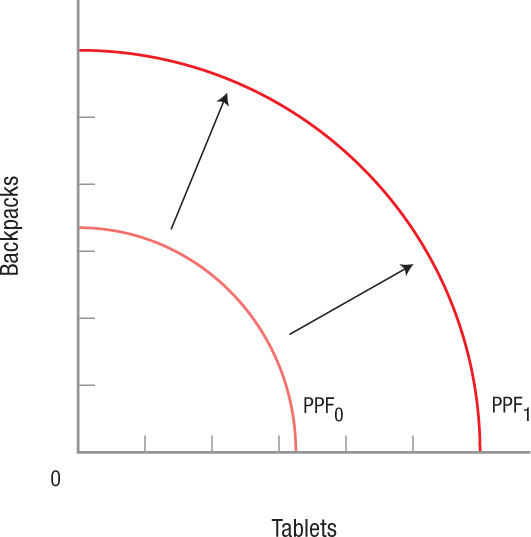
Rather than simply increasing the number of people working, however, the labor factor can also be increased by improving workers’ skills. Economists refer to this as investment in human capital. Education, on-the-job training, and other professional training fit into this category. Improving human capital means people are more productive, resulting in higher wages, a higher standard of living, and an expanded PPF for society.
Capital Accumulation Increasing the capital used throughout the economy, usually brought about by investment, similarly shifts the PPF outward, as shown in Figure 4. Additional capital makes each unit of labor more productive and thus results in higher possible production throughout the economy. Adding robotics and computer-controlled machines to production lines, for example, means each unit of labor produces many more units of output.
The production possibilities model and the economic growth associated with capital accumulation suggest a tradeoff. Figure 5 illustrates the tradeoff all nations face between current consumption and capital accumulation.
FIGURE 5
Consumption Goods and Capital Goods and the Expansion of the Production Possibilities Frontier If a nation selects a product mix in which the bulk of goods produced are consumption goods, it will initially produce at point b. The small investment made in capital goods has the effect of expanding the nation’s productive capacity only to PPFb over the following decade. If the country decides to produce at point a, however, devoting more resources to producing capital goods, its productive capacity will expand much more rapidly, pushing the PPF out to PPFa over the following decade.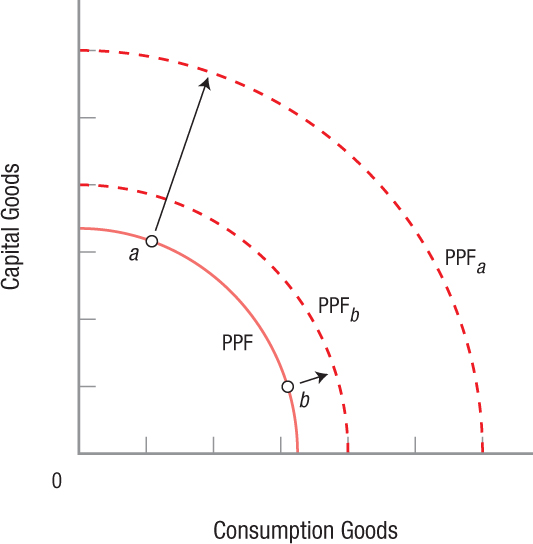
Let’s first assume that a nation selects a product mix in which the bulk of goods produced are consumption goods—that is, goods that are immediately consumable and have short life spans, such as food and entertainment. This product mix is represented by point b in Figure 5. Consuming most of what it produces, a decade later the economy is at PPFb. Little growth has occurred, because the economy has done little to improve its productive capacity—the present generation has essentially decided to consume rather than to invest in the economy’s future.
Contrast this decision with one in which the country at first decides to produce at point a. In this case, more capital goods such as machinery and tools are produced, while fewer consumption goods are used to satisfy current needs. Selecting this product mix results in the much larger PPF a decade later (PPFa), because the economy steadily built up its productive capacity during those 10 years.
Technological Change Figure 6 on the next page illustrates what happens when an economy experiences a technological change in one of its industries, in this case the tablet industry. As the figure shows, the economy’s potential output of tablets expands greatly, although its maximum production of backpacks remains unchanged. The area between the two curves represents an improvement in the society’s standard of living. People can produce and consume more of both goods than before: more tablets because of the technological advancement, and more backpacks because some of the resources once devoted to tablet production can be shifted to backpack production, even as the economy is turning out more tablets than before.
FIGURE 6
Technological Change and Expansion of the Production Possibilities Frontier In this figure, an economy’s potential output of tablets has expanded greatly, while its maximum production of backpacks has remained unchanged. The area between the two curves represents an improvement in the society’s standard of living, since more of both goods can be produced and consumed than before. Some of the resources once used for tablet production can be diverted to backpack production, even as the number of tablets produced increases.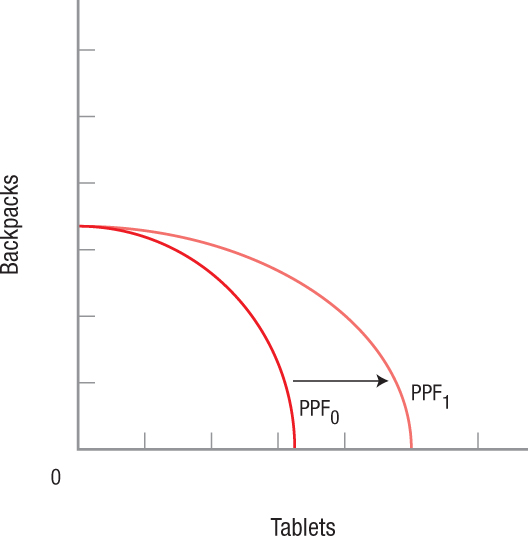
This example reflects the United States today, where the computer industry is exploding with new technologies. Companies such as Apple and Intel lead the way by relentlessly developing newer, faster, and more powerful products. Consequently, consumers have seen home computers go from clunky conversation pieces to powerful, fast, indispensable machines. Today’s computers are more powerful than the mainframe supercomputers of just a few decades ago. And the latest developments in smartphones allow them to do what powerful computers did a decade ago.
Besides new products, technology has dramatically reduced the cost of producing tablets and other high-tech items, allowing countries to produce and consume more of other products, expanding the entire PPF outward. However, the effect of technology on an economy also depends on how well its important trade centers are linked together. If a country has mostly dirt paths rather than paved highways, you can imagine how this deficiency would affect its economy: Distribution will be slow, and industries will be slow to react to changes in demand. In such a case, improving the roads might be the best way to stimulate economic growth.
As you can see, there are many ways to stimulate economic growth. A society can expand its output by using more resources, perhaps by encouraging more people to enter the workforce or raising educational levels of workers. The government can encourage people to invest more, as opposed to devoting their earnings to immediate consumption. The public sector can spur technological advances by providing incentives to private firms to do research and development or underwrite research investments of its own.
Summarizing the Sources of Economic Growth Economic growth is driven by many factors, as we have seen. A study by the Organisation for Economic Co-operation and Development (OECD)1 focused on what has been driving economic growth in twenty-one nations over the last several decades. The study first looked at contributions to economic growth from the macroeconomic perspective of added resources and technological improvements as we have been discussing in this chapter. It then looked at some benefits from good government policies that stimulate growth, and finally examined the industry and individual firm level for clues to the microeconomic sources of growth. The study showed that some of the policies that have led to growth and subsequently higher standards of living in these countries include:
- Increasing business investment (physical capital).
- Increasing average education levels (human capital).
- Increasing research and development.
- Reducing both the level and variability of inflation.
- Reducing the tax burden.
- Increasing the level of international trade.
One important point to take away from this discussion is that our simple stylized model of the economy using only two goods gives a good first framework upon which to judge proposed policies for the economy. While not overly complex, this simple analysis is still quite powerful.
Will Renewable Energy Be the Next Innovative Breakthrough?
For much of modern history, economic growth has relied on the innovative abilities of humans to generate new ideas that translate into productive inputs and valued goods and services. The Industrial Revolution of the 19th century brought us innovations such as the telegraph, steel production, and railways. In the early 1900s, the automobile was invented, along with electricity and telecommunications. In the mid-1900s, commercial air travel and television were introduced. In the latter part of the 20th century, the invention of personal computing led to dramatic gains in productivity. And at the turn of the 21st century, the creation of the Internet once again changed the way we live.
These “waves of innovation,” as described by economist William Baumol, contribute much of the economic growth we have seen over the past century. But to sustain such growth, innovation must not slow down. Instead, pressure to innovate has become more intense as the Earth’s population grows and its resources diminish.
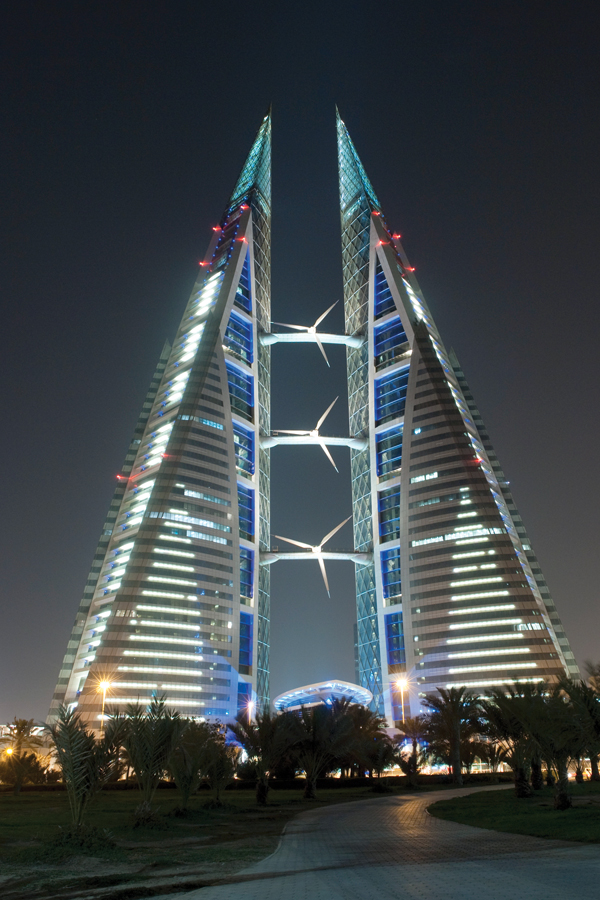
Hence, much attention has been placed on resource scarcity by focusing on expanding renewable resources, particularly energy sources such as those from the sun, wind, and water. Although the renewable energy industry is still developing, substantial strides have been made to increase investment in renewable energy.
The drawbacks of renewable energies are evident in the near term, as expensive solar panels, wind turbines, and hydroelectric dams cost much more to produce than traditional sources of energy such as coal mines and fossil fuels, let alone the often unsightly views such infrastructures create. But these obstacles are changing.
Today, countries around the world are finding innovative ways to incorporate renewable energy sources into their infrastructure, dramatically reducing the use of traditional energy. It may just be a matter of time before innovation finds ways to allow everybody to use the sun, wind, and rain to sustain our energy needs. Succeeding in this endeavor would be an innovative breakthrough that would add to the remarkable list of innovations in our history.
PRODUCTION POSSIBILITIES AND ECONOMIC GROWTH
- A production possibilities frontier (PPF) depicts the different combinations of goods that a fully employed economy can produce, given its available resources and current technology (both assumed fixed in the short run).
- Production levels inside and on the frontier are possible, but production mixes outside the curve are unattainable.
- Because production on the frontier represents the maximum output attainable when all resources are fully employed, reallocating production from one product to another involves opportunity costs: The output of one product must be reduced to get the added output of the other. The more of one product that is desired, the higher its opportunity costs because of diminishing returns and the unsuitability of some resources for producing some products.
- The PPF model suggests that economic growth can arise from an expansion in resources or improvements in technology. Economic growth is an outward shift of the PPF.
QUESTION: Taiwan is a small mountainous island with 23 million inhabitants, little arable land, and few natural resources, while Nigeria is a much larger country with 7 times the population, 40 times more arable land, and tremendous deposits of oil. Given Nigeria’s sizable resource advantage, why is Nigeria’s total annual production only half the size of Taiwan’s?
Although Nigeria has significantly more natural resources and labor (two important factors of production) than Taiwan, these resources alone do not guarantee a higher ability to produce goods and services. Factors of production also include physical capital (machinery), human capital (education), and technology (research and development), all of which Taiwan has in great abundance. Thus, despite the lack of land, labor, and natural resources, Taiwan is able to use its resources efficiently and expand its production possibilities well beyond that of Nigeria.