Indifference Curves and Consumer Preferences
indifference curve Shows all the combinations of two goods where the consumer is indifferent (gets the same level of satisfaction).
If consumers cannot precisely measure the exact satisfaction they receive from specific products, economists reason that people can distinguish between different bundles of goods and decide whether they prefer one bundle over another. This analysis eliminates the idea of measuring consumer satisfaction. It instead assumes that consumers will either be able to choose between any two bundles, or else be indifferent to which bundle is chosen. An indifference curve shows all points at which consumers’ choices are indifferent—points at which consumers express no preference between combinations of two products.
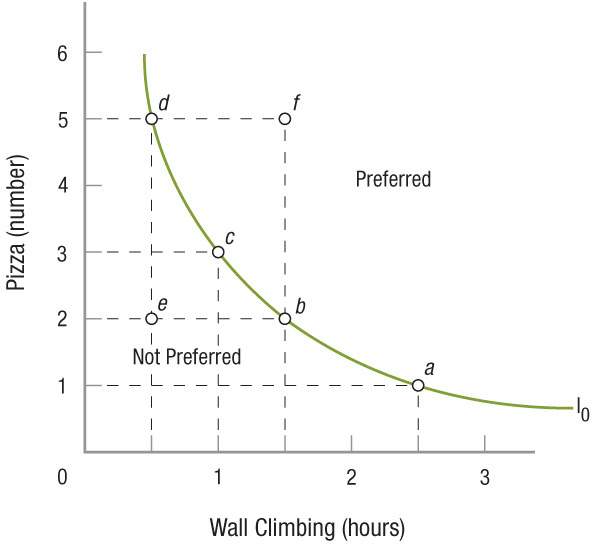
To illustrate how an indifference curve works, let us return to our original example of pizzas and wall climbing, now graphed in Figure APX-1. Compare the combination represented by point b (2 pizzas and 1.5 hours of climbing) and the combination at point e (2 pizzas and 0.5 hour of wall climbing). Which would you prefer, assuming you enjoy both of these? Clearly, the combination at point b is preferable to the combination at point e because you get the same amount of pizza but more wall climbing. By the same logic, bundle f is preferable to bundle b because you get the same amount of climbing, but 3 more pizzas.
FIGURE APX-1
An Indifference Curve All of the different possible combinations lying on the indifference curve I0 represent bundles of goods to which you are indifferent—you would just as soon have any one of these combinations as any other. But compare the combination represented by point b and the combination at point e. Which would you prefer? Point b, of course, because you get more. All points upward and to the right are preferred to all points on indifference curve I0.
These choices have all been easy enough to make. But now assume you are offered bundles d and b. Bundle d contains more pizzas than bundle b, but bundle b has more climbing time. Given this choice, you may well conclude that you do not care which bundle you get—you are indifferent. In fact, all of the different possible combinations lying on the indifference curve I0 represent bundles to which you are indifferent, such that you would just as soon have any one of these combinations as any other. And this tells us what an indifference curve is: It identifies all possible combinations of two products that offer consumers the same level of satisfaction or utility. Notice that this mode of analysis does not require us to consider the precise quantity of utility that various bundles yield, but only whether one bundle would be preferable to another.
Properties of Indifference Curves
Indifference curves have negative slopes and are convex to the origin; they bow inward, that is. They have negative slopes because we assume consumers will generally prefer to have more, rather than less, of each product. Yet, to obtain more of one product and maintain the same level of satisfaction, consumers must give up some quantity of the other product. Hence, the negative slope.
Indifference curves are bowed inward toward the origin because of the law of diminishing marginal utility discussed earlier. When you have a lot of pizzas (point d in Figure APX-1), you are willing to give up 2 pizzas to obtain another half-hour of climbing (moving from point d to point c). But once you have plenty of wall time, yet few pizzas (point b), you are unwilling to give up as many pizzas to get more climbing time. This is the law of diminishing marginal utility at work: As we consume more of any particular product, the satisfaction we derive from consuming additional units of this product falls.
Indifference (or Preference) Maps
indifference map An infinite set of indifference curves in which each curve represents a different level of utility or satisfaction.
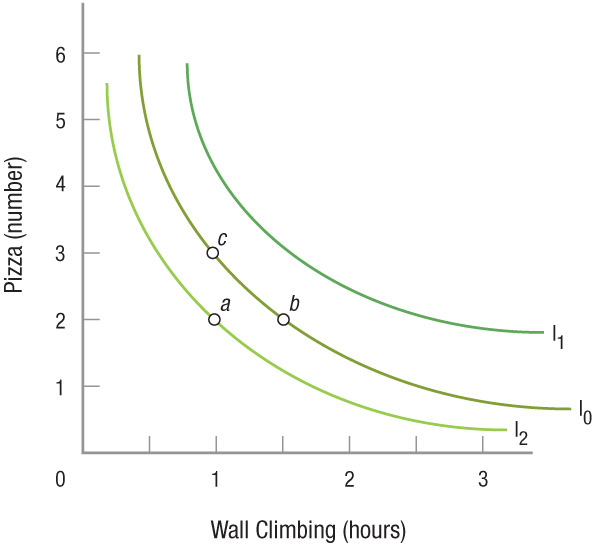
An indifference curve is a curve that represents a set of product bundles to which a consumer is indifferent. An indifference map, or preference map, is an infinite set of indifference curves, each representing a different level of satisfaction. Three possible indifference curves, forming part of a preference map, are shown in Figure APX-2.
FIGURE APX-2
Three Indifference Curves for Pizza and Wall Climbing (An Indifference Map) An indifference map, or preference map, contains an infinite set of indifference curves, each representing a different level of satisfaction. Three possible indifference curves for pizzas and wall climbing, forming part of a preference map, are shown here.
Indifference curve I0 is the same curve shown in Figure APX-1. Indifference curve I1 provides consumers with greater satisfaction than I0 because it is located farther from the origin. In general, utility rises as curves move outward from the origin, because these curves represent larger quantities of both goods. Conversely, indifference curve I2 offers consumers less total satisfaction because it is located closer to the origin and represents smaller amounts of both products than I0.
To confirm the observations just made, compare point a on indifference curve I2 with point b on indifference curve I0. Points a and b contain the same amount of pizza, but point b contains more climbing time. Hence, point b offers a higher level of satisfaction than point a. An analysis of points a and c yields a similar conclusion. Because both points c and b on indifference curve I0 are preferred to point a on I2, indifference curve I0 must generally offer higher levels of satisfaction than the points on indifference curve I2.
This result leads us to one final property of indifference curves: They do not intersect. Because all of the points on any indifference curve represent bundles of goods to which consumers are indifferent, if two indifference curves were to cross, this would mean that some of the bundles they represent offered the same level of satisfaction (where the curves meet), but others did not (where the curves do not touch). Yet, this is a logical impossibility, because each indifference curve is defined as a set of bundles offering exactly the same level of satisfaction.
We now turn to the question of how consumers use such preference maps to optimize their satisfaction within their budget constraints.