Chapter summary
Chapter Summary
Section 1: Market Structure Analysis
A market structure describes an industry based on several characteristics, including the number of firms, nature of the industry’s product, barriers to entry, and the extent to which individual firms can control prices.

Types of Market Structure
Perfect competition: Many price-taking firms producing a nearly identical product.
Monopolistic competition: Many firms producing a differentiated product.
Oligopoly: Few large firms producing a standardized product.
Monopoly: One firm producing a unique product protected by barriers to entry.
Soybeans are produced in a perfectly competitive market. Because each soybean farmer produces a small portion of total soybean production, each farmer has no influence on price, and is therefore a price taker.
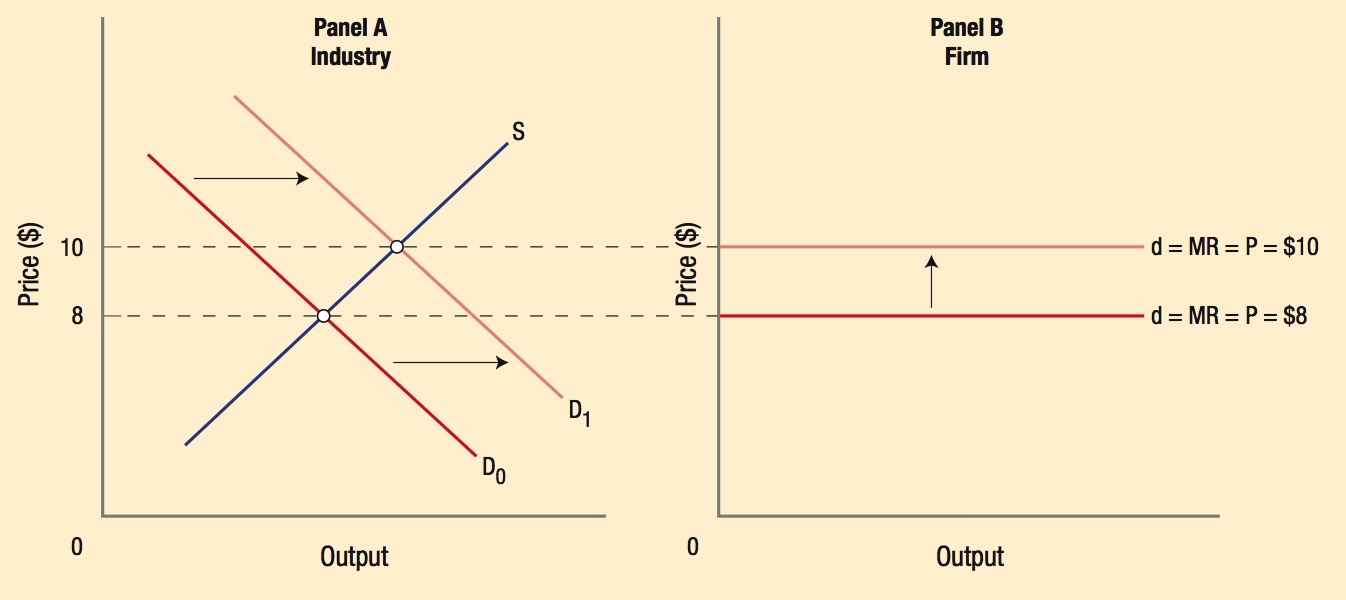
In a perfectly competitive market, the price of a good is determined by ordinary industry supply and demand curves, and that price becomes the horizontal demand curve for the price-taking firm. Any shift in demand or supply (such as the demand shift from D0 to D1) causes price to change for the firm.

Section 2: Perfect Competition: Short-Run Decisions
Marginal revenue is the change in total revenue from producing one more unit, or ΔTR/ΔQ. In a perfectly competitive market, price does not change, therefore P = MR.
The profit maximizing rule says that firms maximize profit at an output where marginal revenue equals marginal cost.
When price (MR) > MC, the firm should increase production.
When price (MR) < MC, the firm should decrease production.

Five Steps to Maximizing Profits in a Competitive Market:
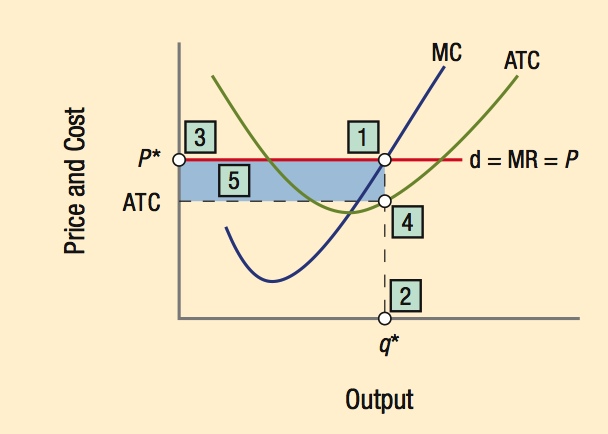
- Find MR = MC
- Find optimal quantity where MR = MC
- Find optimal price (Hint: It’s already given!)
- Find the average total cost at the optimal Q
- Find the profit = Q × (P − ATC)
In the graph below, this competitive firm is earning economic profits equal to the blue shaded area.
Economic Versus Normal Profits
Economic profits take into account all explicit costs AND implicit costs such as the value of the next best use of time and money (opportunity cost).

Normal profits occur when economic profits are zero. But remember, zero economic profits can still represent substantial normal profits on paper.
The Short-Run Supply Curve for a Competitive Firm
When P < AVC: The firm shuts down immediately.
When AVC < P < ATC: The firm operates in the short run to minimize losses, but exits the industry in the long run. The MC curve above AVC equals the firm’s short-run supply curve.
When P > ATC: The firm is earning economic profits. The MC curve above ATC equals the firm’s long-run supply curve.
Section 3: Perfect Competition: Long-Run Adjustments
Firm Entry and Exit
Because perfectly competitive markets have no barriers to entry, short-run profits and losses are eliminated in the long run.
Short-run profits encourage new firms to enter, shifting supply right, lowering price until profits return to zero.

Short-run losses encourage inefficient firms to exit, shifting supply left, raising price until losses are eliminated.
Productive and Allocative Efficiency
In the long run, the price of goods in a perfectly competitive market equals the minimum point on the LRATC curve. This demonstrates productive efficiency (goods are produced at their lowest possible cost) and allocative efficiency (goods are produced according to what society desires).
A long-run industry supply curve is flatter than a short-run industry supply curve, and can slope upward (increasing cost industry), downward (decreasing cost industry), or can be horizontal (constant cost industry). Costs are determined by industry structure, technology, and economies of scale.