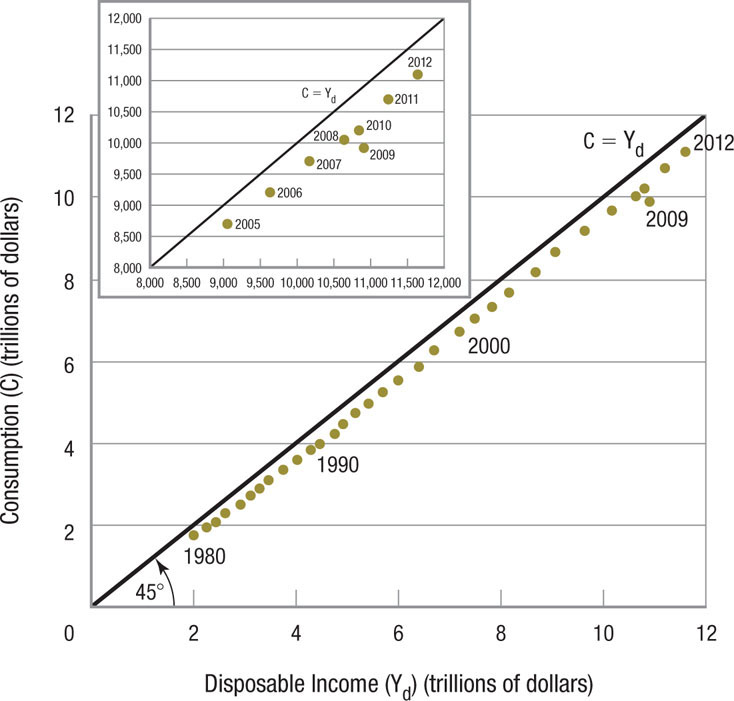
Consumption and Disposable Income This graph shows personal consumption spending (C) for the years since 1980. The 45° line inserted in the figure represents the points at which consumption is equal to disposable income (Yd). If an economy spends its entire annual income, saving nothing, the 45° line would represent consumption. Annual saving (S) is equal to the vertical difference between the 45° reference line and annual consumption (S = Yd − C).