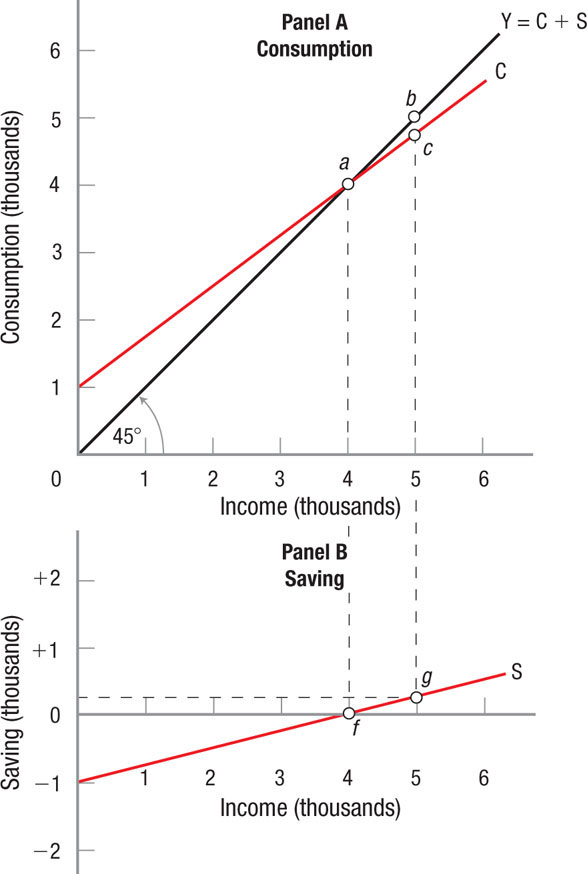
Consumption and Saving The consumption and saving schedules from Table 1 are graphed here. Panel A extends the consumption schedule back to zero income, where consumption is equal to $1,000 and saving is equal to −$1,000. At the point where the consumption schedule crosses the reference line (point a, Y = $4,000), saving is zero. The saving schedule in panel B simply plots the difference between the 45° reference line and the consumption schedule in panel A. Thus, when income = $5,000, saving = $250 [line (b − c) in panel A, point g in panel B].