Linear Relationships
Figure APX-6 shows a linear relationship between average study hours and grade point average (GPA), indicating a higher GPA the more you study. By a linear relationship, we mean that the “curve” is a straight line. In this case, if you don’t study at all, we assume you are capable of making Ds and your GPA will equal 1.0, not enough to keep you in school for long. If you hit the books for an average of 10 hours a week, your GPA rises to 2.0, a C average. Studying for additional hours raises your GPA up to its maximum of 4.0.
The important point here is that the curve is linear; any hour of studying yields the same increase in GPA. All hours of studying provide equal yields from beginning to end. This is what makes linear relationships unique.
Computing the Slope of a Linear Line
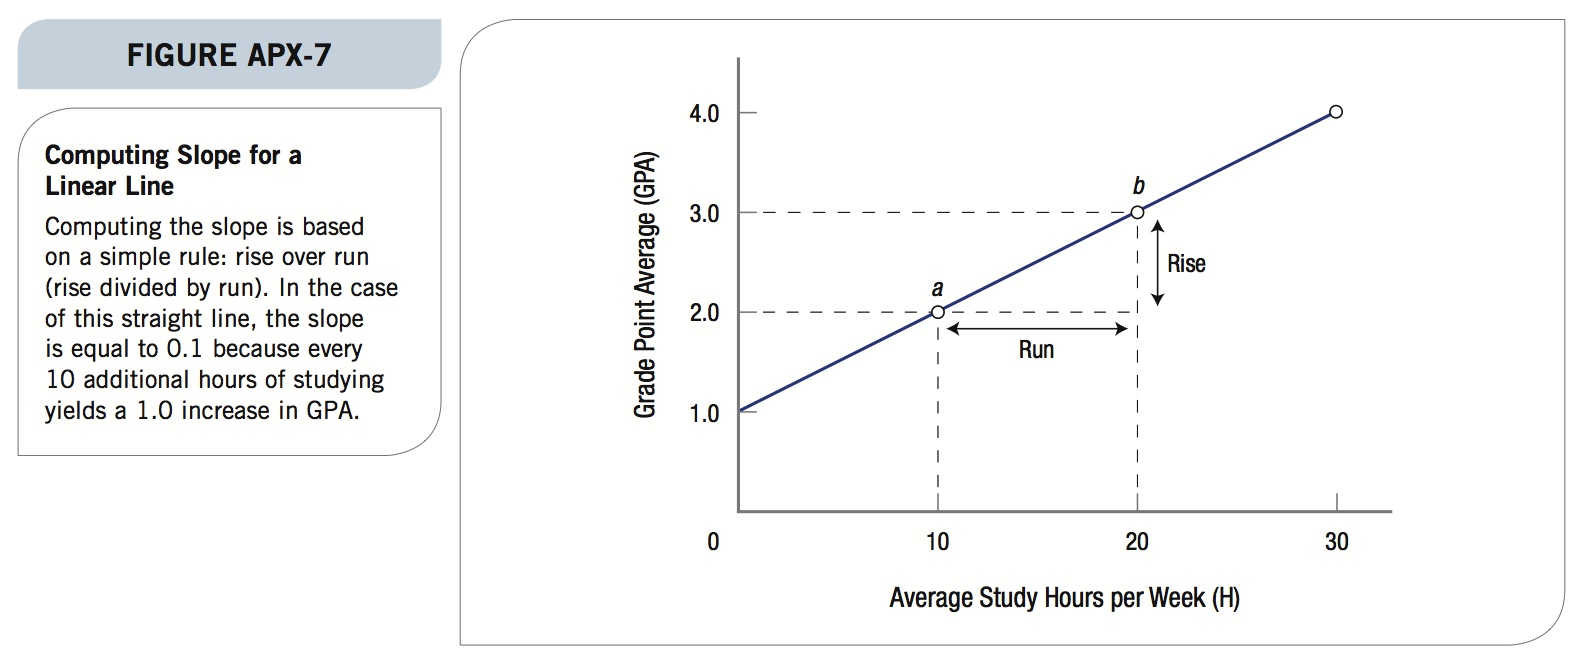
Looking at the line in Figure APX-6, we can see two things: The line is straight, so the slope is constant, and the slope is positive. As average hours of studying increase, GPA increases. Computing the slope of the line tells us how much GPA increases for every hour of additional studying. Computing the slope of a linear line is relatively easy and is shown in Figure APX-7.

23
The simple rule for computing slope is: Slope is equal to rise over run (or rise ÷ run). Since the slope is constant along a linear line, we can select any two points and determine the slope for the entire curve. In Figure APX-7 we have selected points a and b where GPA moves from 2.0 to 3.0 when studying increases from 10 to 20 hours per week.
Your GPA increases by 1.0 for an additional 10 hours of study. This means that the slope is equal to 0.1 (1.0 ÷ 10 = 0.1). So for every additional hour of studying you add each week, your GPA will rise by 0.1. Thus, if you would like to improve your grade point average from 3.0 to 3.5, you would have to study five more hours per week.
Computing slope for negative relations that are linear is done exactly the same way, except that when computing the changes from one point to another, one of the values will be negative, making the relationship negative.