Poverty
Thus far, we have examined income distribution in general terms, looking at the spectrum from the top to the bottom. This section focuses on the bottom of the income spectrum—those who live in poverty. First, we look at poverty thresholds and how they are defined. Then we turn to the incidence of poverty and its trends. We then take a brief look at some experimental measures of poverty, considering their impact on measured rates of poverty. Lastly, we discuss the causes of poverty and how poverty can be reduced.
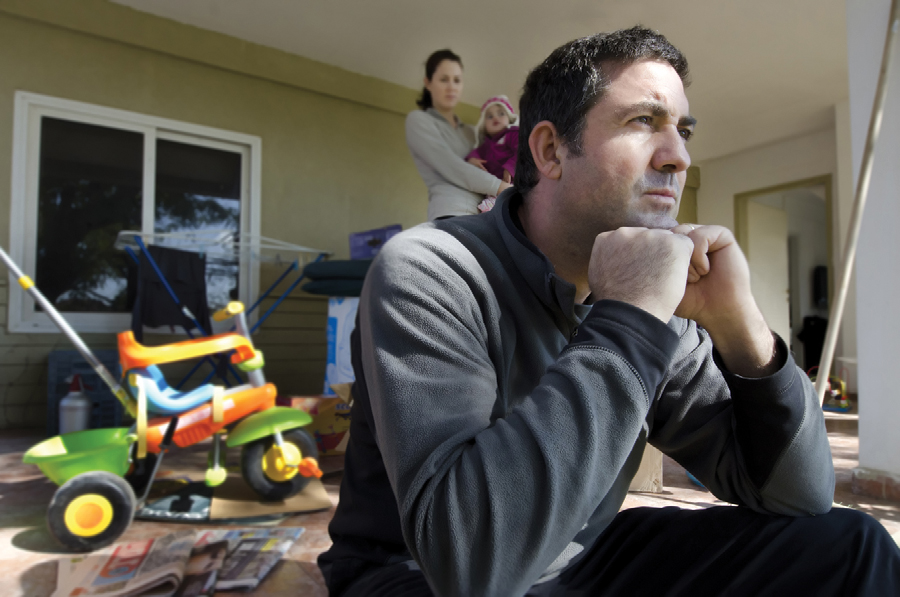
How difficult is life in poverty? A household of four in the United States that lived on less than $23,021 in the year 2011 was considered in poverty. That is equivalent to one wage earner working full-time as a maintenance worker at an apartment complex earning $11.50 per hour, or about $1,900 per month before taxes. And this is a household living right at the poverty line; many households earn even less. Can a family get by on such meager income? In the United States, about 15% of all households do.
399
A household of four living on $1,900 per month can expect to have $1,675 after payroll and other taxes are deducted. Subtracting the rent on a modest subsidized apartment or a public housing apartment of $600 per month, $250 per month in utilities (electricity, gas, water, trash pickup, telephone, and basic Internet and cable), $250 per month toward a car payment, and $175 per month for fuel and auto insurance, this household has $400 left, or about $100 per week for everything else: food, clothing, school expenses, health care insurance, child care, and entertainment. Not to mention the occasional car repair, doctor and dentist co-payment, or parking ticket. And it certainly does not leave much to buy a $5 cup of coffee.
Living in poverty means that tough choices must be made to make ends meet. Some choose to give up their car and instead rely on public transportation. Others give up cable or the landline telephone. In more severe cases, some households are forced to cut back on food or health care. These choices are faced by one out of six persons in the United States. Why does the world’s richest nation have so many poor citizens? Let’s start to answer this by looking at how poverty is measured.
Measuring Poverty
poverty thresholds Income levels for various household sizes, below which people are considered to be living in poverty.
Poverty thresholds were developed by Mollie Orshansky in the 1960s. They were based on the Department of Agriculture’s Economy Food Plan, the least expensive plan by which a family could feed itself. The Department of Agriculture first surveyed the food-buying patterns of low-income households, using these data to determine the cost of a nutritionally balanced food plan on a low-income budget. Orshansky then extrapolated these costs to determine the cost of maintaining such a food plan for households of various compositions. Finally, to determine the official poverty threshold, Orshansky multiplied the cost of the food plan, adjusted for family size, by three. This multiplier was based on an earlier household survey that had shown the average family of three or more spends roughly a third of its income on food.2
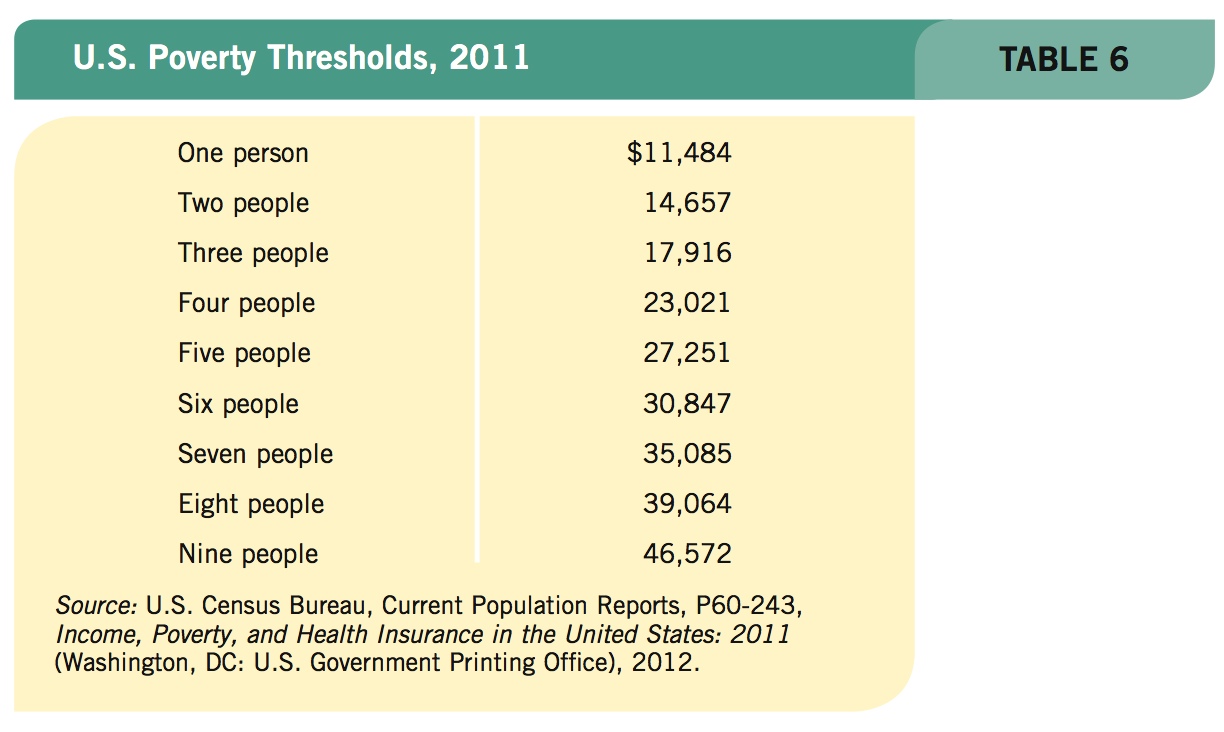
Since the 1960s, the poverty thresholds have been updated every year for changes in inflation using the consumer price index (CPI). Table 6 shows the poverty thresholds for 2011. If a family’s income is less than the threshold, every person in the household is considered poor. Official thresholds do not vary geographically. “Income” includes all money income before taxes, including cash benefits, but not capital gains or noncash benefits such as public housing, food stamps, and Medicaid. Later, we will briefly look at some new alternative measures that do adjust for these factors.
400
The Incidence of Poverty
Poverty rates for the United States since 1960 are shown in Figure 5. Poverty fell rapidly between 1960 and 1975 but has remained roughly stable ever since, fluctuating with the business cycle: rising around recessions (the shaded vertical bars) and falling when times are good.
FIGURE 5
Poverty Rates in the United States, 1960–2011 Poverty fell rapidly between 1960 and 1975 but has remained roughly stable ever since.Source: U.S. Census Bureau, Current Population Reports, P60-243, Income, Poverty, and Health Insurance in the United States: 2011 (Washington, DC: U.S. Government Printing Office), 2012.

Poverty rates vary considerably along racial and ethnic lines. Figure 6 charts the poverty rate since 1970. Over most of this time, the poverty rate for blacks and Hispanics was roughly twice the rate for whites. Both of these minority groups benefited, however, from the strong economic growth of the 1990s, their poverty rates dropping from around 30% at the beginning of the decade to around 25% today. White poverty remained fairly steady over the 1990s, fluctuating between 10% and 11%. However, the recession in 2007–2009 and the slow economic recovery pushed the poverty rate for whites above 12%.
FIGURE 6
Poverty Rates by Race and Ethnic Origin, 1970–2011 Poverty rates vary considerably along racial and ethnic lines. Over most of this period, the poverty rate for blacks and Hispanics was roughly twice the rate for whites. Both of these minority groups benefited, however, from the strong economic growth of the 1990s, their poverty rates dropping from around 30% at the beginning of the decade to around 25% today. White poverty remained fairly steady over the 1990s, fluctuating between 10% and 11%, but rose above 12% after the 2007–2009 recession.Source: U.S. Census Bureau, Current Population Reports, P60-243, Income, Poverty, and Health Insurance in the United States: 2011 (Washington, DC: U.S. Government Printing Office), 2012.

These data suggest that robust economic growth is a major force for reducing poverty. The expression “a rising tide floats all boats” would appear to have something to it.
401
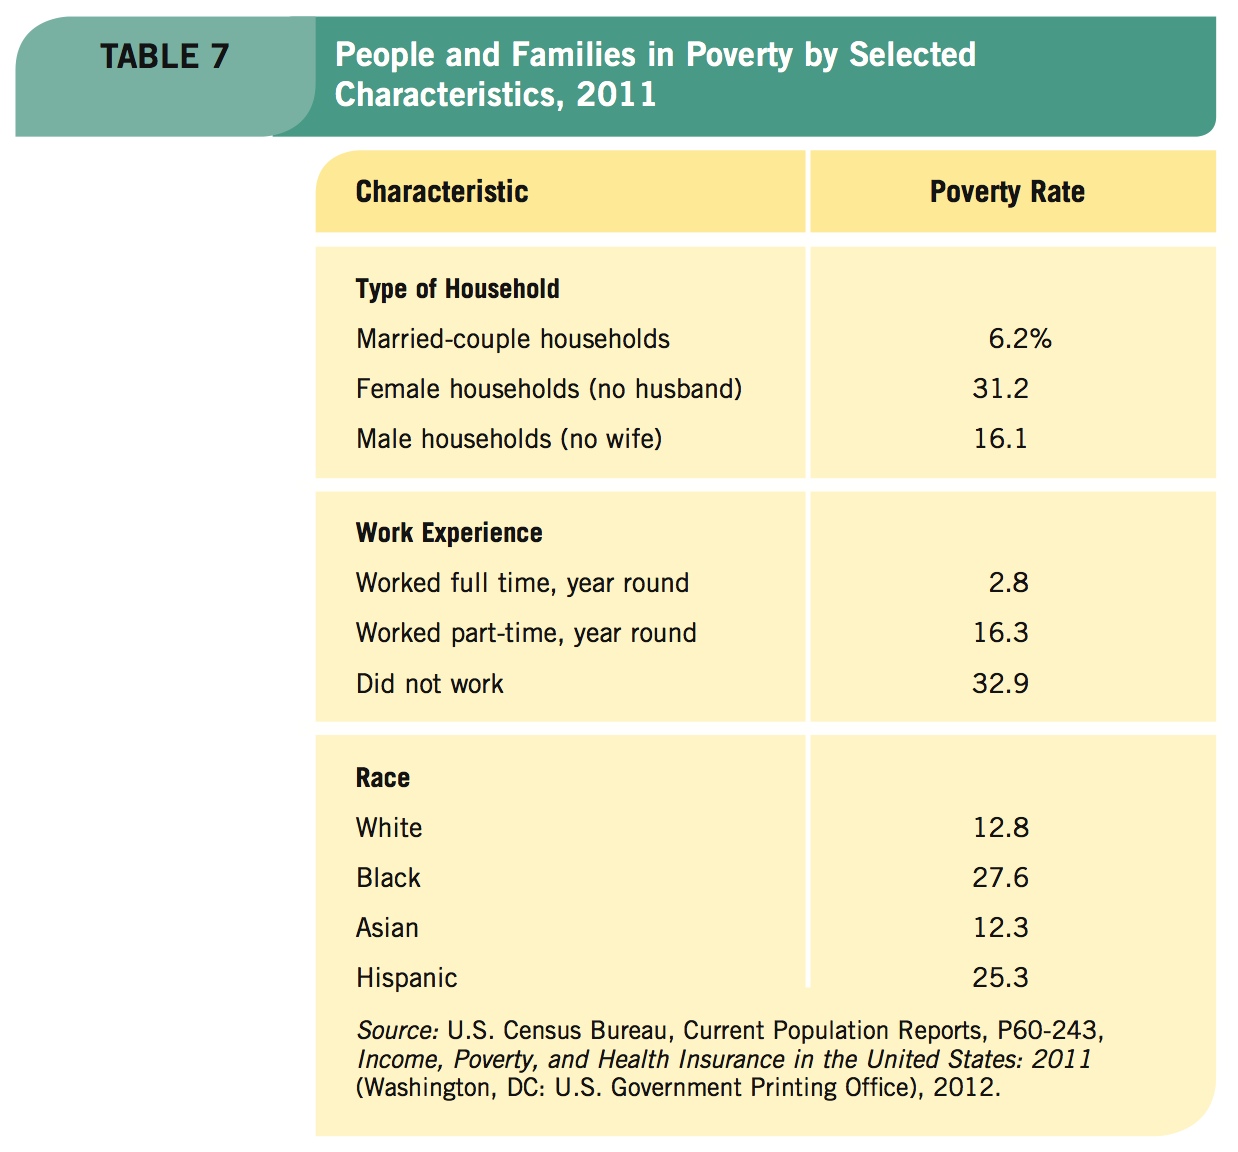
Table 7 shows other characteristics that contribute to poverty. Single parent households have 2 to 5 times the poverty rate of married couples. Not surprisingly, working part-time or not working at all leads to higher poverty rates. And, as we saw in Figure 6, black and Hispanic poverty rates are roughly twice that of whites.
Depth of Poverty
income deficit The difference between the poverty threshold and a family’s income.
It is one thing to say that a certain percentage of the population is poor. It is another to determine just how poor they are. The poverty threshold for a family of four today is over $23,000. If most poor families have incomes approaching this threshold, we could be confident that poverty was just a transitory stage—one phase of the life cycle—and that many people who are poor today would have higher incomes tomorrow.
ratio of income to poverty The ratio of family income to the poverty threshold. Families with ratios below 0.5 are considered severely poor, families with ratios between 0.5 and 1.0 are considered poor, and those families with ratios between 1.0 and 1.25 are considered near poor.
But if, conversely, many poor families have incomes below $10,000, our view of poverty would be different, and our public policies aimed at reducing poverty would need to be considerably more robust.
To gain a view of the broad spectrum of poverty, economists have developed two depth of poverty measures that describe the economic well-being of lower income families. One measure, the income deficit, tells us how far below the poverty threshold a family’s income lies. In 2011, the income deficit for families living in poverty averaged $9,576. Using the poverty threshold for a family of four, the average income for a family living in poverty was $13,445.
The second measure of poverty, the one we will focus on, is the ratio of income to poverty. It compares family income to the poverty threshold and expresses this comparison as a ratio. Thus, the ratio for families with incomes equal to the poverty threshold equals 1.0; the ratio for those living at half the threshold income is 0.5. The Census Bureau considers people who live in families with ratios below 0.5 to be “severely or desperately poor.” Those with ratios between 0.5 and 1.0 are “poor,” and people with ratios above 1.0 but less than 1.25 (less than 25% above the poverty threshold) are considered to be “near poor.”
402
Of the 46 million poor people in 2011, over 20 million of them were desperately poor, and an additional 15 million were categorized as near poor. These measures (income deficit and the ratio of income to poverty) provide us with a more nuanced picture of poverty.
Alternative Measures of Poverty Many researchers have questioned the relevance of the current method for determining poverty thresholds. The National Academy of Sciences studied the official approach to poverty thresholds and concluded that the measure is flawed because “[it]counts taxes as income, [and] is flawed in the adjustments to the households for different family circumstances.”3
The study further concluded that the current poverty measure does not distinguish well among working parents, workers generally, nonworkers, or people with higher versus lower health care needs and costs. Finally, noting that the current threshold is just the threshold from “1963 updated for price changes,” the panel questioned the value of such a simplistic approach, given how much the U.S. standard of living has changed.
Given the Academy’s findings, the Census Bureau developed some new ways of measuring poverty. These alternative measures of poverty differ from the old in basing their estimates on after-tax income plus capital gains and counting as income such noncash benefits as food stamps and housing subsidies plus imputed return on home equity (that is, the savings from owning a home versus paying rent each month).
403
The Census Bureau derived its new estimates of income thresholds from a survey of expenditures on food, clothing, housing, utilities, and other necessities for the typical family of four (two adults and two kids). These figures were then adjusted to reflect differences in family composition and size, given that children consume less than adults, some household economies are associated with larger families, and the first child in a one-adult family costs more to support than the first child in a two-adult family. Under these measures, poverty rates fell by roughly a quarter.
Causes of Poverty
The reasons why poverty persists are wide-ranging. Traditional causes of poverty include a lack of human capital, mental or physical disabilities, and drug addictions that inhibit persons from achieving gainful employment. Reasons also include an unwillingness to work or an apathy toward work that leads to frequent terminations. Another reason for poverty is that some people refuse to relocate for work, despite having the skills and work ethic to escape poverty. This last reason explains why many communities in rural Appalachian states continue to experience high poverty rates: As industries moved out and jobs disappeared, residents chose to remain, seeking jobs that pay meager wages.
Why Do We Use an Outdated Measure of Poverty?
Why does the United States still define poverty as 3 times the cost of a 1963 low-income food budget adjusted for inflation? You might think that government policymakers could design a measure that reflects a family’s well-being by looking at more than just money income based on some old formula a half-century old.
Based on this measure, poverty rates have fluctuated between 10% and 15% over the last four decades. But in that time, antipoverty programs were generously increased to include reduced tax burdens on the poor, as well as the expansion of food stamp and housing programs, the earned income tax credit, and Medicare, Medicaid, and other programs that have undoubtedly helped the poor. But the measure doesn’t reflect this success and as a result provides little guidance to solving poverty. As Professor Rebecca Blank at the University of Michigan observes, “In a very fundamental way, our poverty statistics failed us and made it easy to claim that public spending on the poor had little effect.”
Why has the Census Bureau failed to update our poverty measure in the same way that employment, unemployment, consumer prices, national income accounts, and many other economic statistics have been improved? The answer is straightforward and surprising. Through a historical accident, the Executive Office of the President is in charge of the measure. The decision rests with the Office of Management and Budget (OMB), and the president must ultimately approve any change. To date, no White House has been willing to approve any change. If a change in measurement results in falling poverty rates, some will claim manipulation. If a change results in higher poverty rates, the administration risks being seen as a failure on this front. Ultimately, we will probably not see improvement until Congress gives the Census Bureau responsibility for the statistic.
Source: Rebecca Blank, “Presidential Address: How to Improve Poverty Measurement in the United States,” Journal of Policy Analysis and Management, 2008, pp. 233–254.
As economic and social change took place in recent decades, new factors have contributed to the rise in poverty. First, wages generally have not kept up with rising costs; specifically, a single parent working at the minimum wage cannot escape poverty today, when 40 years ago it was possible. Second, technological changes and globalization have changed employment opportunities and led to unemployment in certain industries that forced people into poverty. Third, rising health costs have led some to give up work to care for an ill family member, forgoing earnings. And finally, changes in family structure, particularly an increase in single parenthood, have made it more difficult to avoid a life of poverty. These reasons and others have encouraged policymakers to rethink approaches to eliminating poverty.
Eliminating Poverty
Poverty can be a relative or an absolute measure. As we saw earlier, the official measure of poverty in the United States is based on an absolute number, the poverty threshold. Some researchers, however, think a relative measure would be more useful, such as labeling the bottom 20% of American households as “poor.”
404
What Is Considered “Poor” Around the World?
Every country uses its own definition of what constitutes being poor. In the United States, the official poverty threshold is calculated as an absolute measure. This means a family of four making $23,000 or less in the year 2011 was considered poor. However, a family of four making $23,000 a year in China or India would be considered quite wealthy in their countries. Compared to many developing countries, being poor in America still allows for a relatively comfortable life.
Many countries in the European Union, however, use a relative measure of poverty. In Denmark, a family is considered poor if it earns less than 60% of the median income. With the median household income being over $75,000 a year, this means a family earning less than $45,000 a year is considered poor. In addition, Denmark offers full health care coverage to every citizen and free college tuition. Certainly an American family earning $45,000 a year and receiving free health care and college educations for its children would not be considered poor.
The main culprits for the difficulty in defining and comparing poverty rates between countries involve differences in the cost of living, the role of government, and overall economic development. In rich countries, the cost of living is higher, governments often provide more services, and citizens have a higher expectation of what is considered necessary for survival. In poor countries, the cost of living is low, governments often cannot provide much assistance, and citizens are merely surviving.
To provide a better comparison of poverty across the world, various organizations have devised methods to compare living standards and poverty rates across countries. The United Nations publishes the Human Development Index each year, which provides an overall picture of a country’s living standard based on factors such as access to education, running water and sanitation, health care, and communications. However, it does not provide a percentage of the country being poor. The World Bank uses an absolute measure with thresholds ranging from $1.25 a day (extreme poverty) to $2 a day, adjusted to the cost of living, to estimate the number of poor in mostly developing countries. Finally, the Organisation for Economic Cooperation and Development (OECD) publishes comparisons of poverty rates among mostly developed countries based on a fixed percentage of median incomes.
The availability of these statistics allows us to compare poverty rates around the world better. Still, difficulties remain when cultural differences influence what is considered vital for survival in each country.
If we decide to use such a measure, poverty will never be eliminated, no matter how wealthy our country might become. A relative measure obscures the fact that poverty in the United States means something different than it does in the developing world. In the United States, being poor might mean scraping by paycheck to paycheck and having to give up such things as cable television or eating out. In some developing countries, being poor might mean literally starving.
The official U.S. poverty threshold for an individual is an income of roughly $30 a day. In the developing world, by contrast, the World Bank and other agencies define poverty as incomes of less than $2 a day. By World Bank standards, poverty has already been eradicated in the United States.
Reducing Income Inequality Regardless of how poverty is defined, the question of how to reduce it is controversial. The political left views income and wealth redistribution as the chief means of reducing poverty. Social justice, they argue, requires that the government provide an extensive safety net for the poor. In their view, services that the government already provides, including public education, housing subsidies, Medicaid, and unemployment compensation, should be greatly expanded.
405
They say these policies should be supplemented, moreover, by increasing the progressivity of the tax system. This would reduce the inequalities in wealth and income. By increasing the tax burden on the well-to-do, people of modest incomes could lead more meaningful and just lives. It may also reduce acts of desperation, such as shoplifting and home burglaries, representing an external benefit from reducing poverty.
Increasing Economic Growth The opposite side of the political spectrum argues that such programs, when allowed to become too expansive, can be disastrous. Welfare significantly reduces the incentive to work and produce, thereby reducing the economy’s output. A vibrant market economy accommodates the wishes of those who want full-time, upwardly mobile careers as well as those who only want just enough work to pursue other goals.
Because wages provide nearly 70% of all income, those on the political right note that there inevitably will be some inequality in a market system. Some people, after all, make bad choices and fail to invest enough in their education or job skills. Yet, the possibility of failure itself provides an incentive to work hard and invest, and the political right sees this sort of efficiency in the economy as being more important than equity or fairness. The best way to cure poverty, they argue, is by implementing policies that increase the economic pie shared by all, not just by splitting up the pie more evenly.
This political dispute has fueled a controversy in economics. One group of economists argues that economic growth raises low incomes at a rate similar to that of average incomes, such that the poor benefit from growth just as much as anyone else. Other economists reply that the shift toward freer markets around the world, combined with the resulting economic growth, has widened inequalities, causing the poor to fall further behind.
Who is right? Jagdish Bhagwati, a well-known development economist, argued that economic growth creates gainful employment, lifting people out of poverty. Further, economic growth increases government revenue, allowing for greater spending on health and education for the poor. He argues that
in economic terms, growth [is] an instrument, not a target—the means by which the true targets, like poverty reduction and the social advancement of the masses, would be achieved.
He adds a caveat, however, that
the political sustainability of the growth-first model requires both symbolic and material efforts. While growth does benefit the poor, the rich often benefit disproportionately. So to keep the poor committed to the system as their economic aspirations are aroused, the wealthy would be well advised to indulge less in conspicuous consumption.4
In sum, Bhagwati states that economic growth raises all incomes in absolute terms, including the poor, which reduces poverty. However, relative incomes may continue to suffer, as income inequality can widen with economic growth.
Rawls and Nozick Unfortunately, there is no unified theory of income distribution that takes the various issues we have discussed into account. Earlier chapters suggested that income depends on productivity—in competitive markets, each input (factor) is paid the value of its marginal product.
Human capital analysis adds that as people invest in themselves, their productivity and income rise. Analysis of imperfect input markets, however, shows that income distribution advantages accrue more to those with market power.
Our analysis of economic discrimination suggested several more reasons why incomes may be skewed in favor of some groups rather than others. The bargaining strength of labor unions is yet another factor that can skew income distribution, in this case in favor of union members.
406
These analyses have focused, in one way or another, on whether certain patterns of income distribution are economically efficient. Yet, how do we know whether various income distributions are equitable or fair? Is there anywhere to turn for theoretical help in addressing this question? The answer is a qualified “yes.” Two philosophers, John Rawls and Robert Nozick, published competing views on this subject in the early 1970s.5
John Rawls proposed the “maximin principle,” in which he argued that society should maximize the welfare of the least well-off individual. He asks us to conduct a thought experiment: Assume that you must decide on the income distribution for your society, without knowing where in the distribution you will end up. Because chance could lead to you being the least well-off individual in the society, Rawls suggests people would favor significant income redistribution under these circumstances.
Robert Nozick argued that it is “illegitimate to use the coercive power of the state to make some better off at the expense of others.” To Nozick, justice requires protecting property rights “legitimately acquired or legitimately transferred.”6 Using Nozick’s argument, a small group of friends in Finland who developed a game called Angry Birds that became a worldwide addiction, and subsequently became wealthy because millions willingly bought premium game subscriptions, cannot be considered unjust. Instead, Nozick would argue it would be unjust if the creators were not rewarded for their innovation that has provided countless hours of fun for so many people.
This debate highlights the perennial tradeoff in economic policy between equity and efficiency, a tradeoff that serves as a bone of contention in nearly every discussion of economic and public policy. Although microeconomics is sometimes beset by controversy, at its best it provides us with a dispassionate framework for analyzing and discussing many issues.
Mobility: Are Poor Families Poor Forever? The poverty rates and income distribution data provide a snapshot in time. How about over time? What is the human side to this? Do people start in poverty or fall into poverty and then stay there, or is there movement out of poverty?
A study by the U.S. Census Bureau tracking over 43,000 American households from 2004 to 2006 provides an answer. The study found that of the households that were living in poverty at the start of 2004, 42% were no longer living in poverty by the end of 2006.7 Of these households, about half were living just above the poverty line, while the other half did much better and were earning incomes well above the poverty line. The results indicate that mobility between income groups is possible, and that not all who are in poverty stay there forever.
However, additional data from the Census Bureau tells the other side of the story. Although millions of households pull themselves out of poverty each year, millions more find themselves falling into poverty. During the last economic recession and the slow economic recovery that followed, millions of households fell into poverty for the first time, causing the poverty rate to rise above 15% in 2010. The fortunate news is that many of these households will remain in poverty only temporarily as new jobs are created with continued economic growth.
The movements of households in and out of poverty mirror the findings of the University of Michigan’s Panel Study of Income Dynamics, which has followed 18,000 individuals since 1968. It shows how fluid the income distribution really is. Data from this study show that within a 10-year period, over half of individuals in the poorest income quintile moved up the income distribution ladder. Surprisingly, the same pattern of mobility appears in the richest quintile: Roughly half were replaced by households from other quintiles. Overall, only one-third to one-half of all households remained in the original quintile after a decade.
407
Chris Tilly, director of UCLA’s Institute for Research on Labor and Employment, states that “poverty is dynamic; not everybody stays in poverty long term. We’ve always known that people move in and out of poverty, [but] there are people who tend to get stuck.”8 Households that remain in poverty over time, although a relatively small percentage of the population, are the most worrisome. Research by Richard B. Freeman of Harvard tells us that there is a core of poor people who stay poor. This core has physical disabilities, suffers from substance abuse, or is unable to work for a host of other reasons.
These findings suggest that poverty will never be totally eradicated. They also suggest that policies to deal with core poverty should be different from policies that deal with people who start or who have fallen into poverty but are highly likely to escape.
POVERTY
- Poverty thresholds were developed in the 1960s based on a food budget, adjusted for family size, then multiplied by 3.
- Economic growth has been a major force in reducing poverty in the United States.
- The income deficit measures how far below the poverty threshold a family’s income lies.
- The other depth of poverty measure is the ratio of income to poverty. If the ratio is below 0.5, the family is considered “severely or desperately poor.” A ratio greater than 1.0 but less than 1.25 indicates the family is “near poor.”
- The Census Bureau has introduced new measures of poverty that consider health care costs, transportation needs, and child care costs.
- The controversy surrounding reducing poverty centers on whether reducing income inequality or increasing economic growth is the best approach.
- Philosopher John Rawls proposed a “maximin principle” that suggests society should maximize the welfare of the least well-off individual.
- Robert Nozick argued that the state should not use its coercive power to make some people better off at the expense of others.
- Income mobility is quite robust in the United States, with more than half of all families moving up and down the income distribution ladder in any decade.
QUESTION: Return to the suggestion by economist Charles Murray that the United States should eliminate all social insurance, including Social Security, Medicare, Medicaid, and other welfare programs, and instead give $10,000 each year to each citizen over 21 years of age. Again, expand his idea by eliminating the age restriction. Would this eliminate poverty in America? Would this satisfy those on the left who wish to reduce inequality in income distribution? What do you think would be the response to such an idea by those on the political right?
Based on the poverty thresholds, poverty would almost be eliminated by this proposal. In general, the political left would welcome this redistribution except for the elimination of the social safety net. Some people would make bad decisions and not save for retirement or purchase health care coverage, and the political left would still want these services to exist, defeating the idea of the proposal. The political right would worry that once the redistribution scheme is introduced, enough people would reduce their working hours to harm economic growth. Further, the political right would worry that after the redistribution, the safety net would creep back into existence, eroding the benefits of the original idea.
408