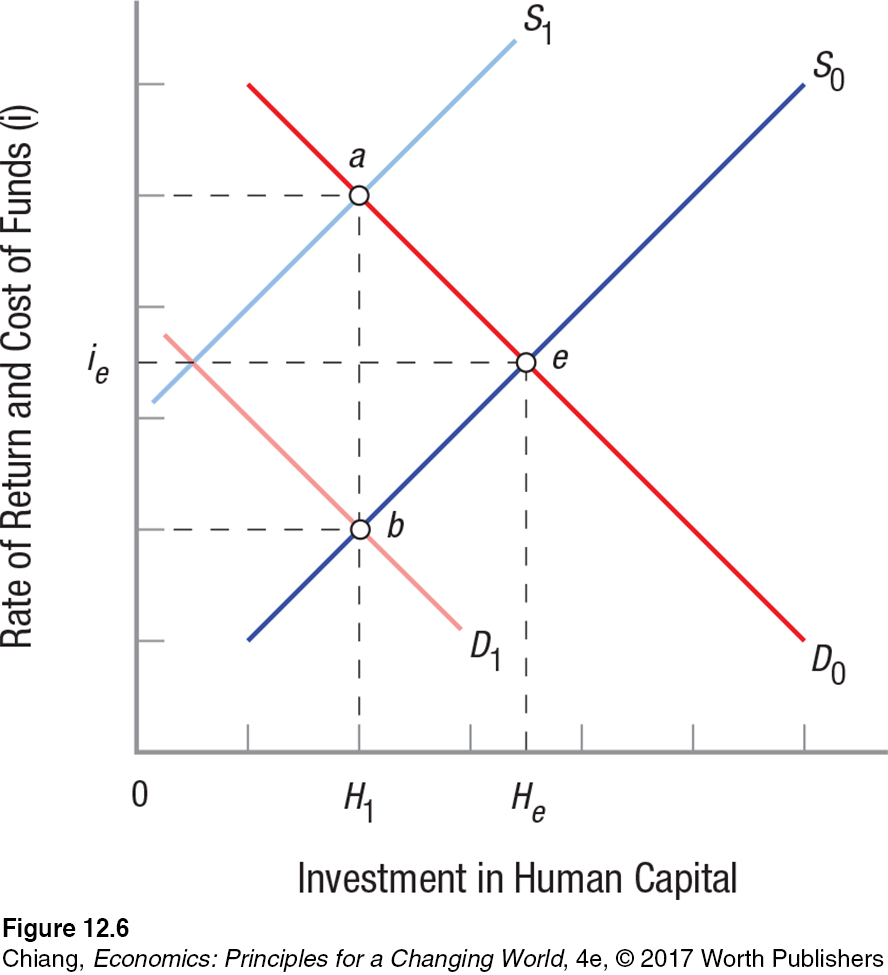
FIGURE 6 EQUILIBRIUM LEVELS OF INVESTMENT IN HUMAN CAPITAL
 This graph portrays a hypothetical market for human capital; the percentage rates of return and the interest costs of borrowing funds are shown on the vertical axis. With demand D0 and supply S0, equilibrium will be at point e. If the supply of funds is reduced (S1), interest rates and the cost of investment increase, resulting in less investment. Reduced demand for education (D1) similarly reduces human capital investment.
