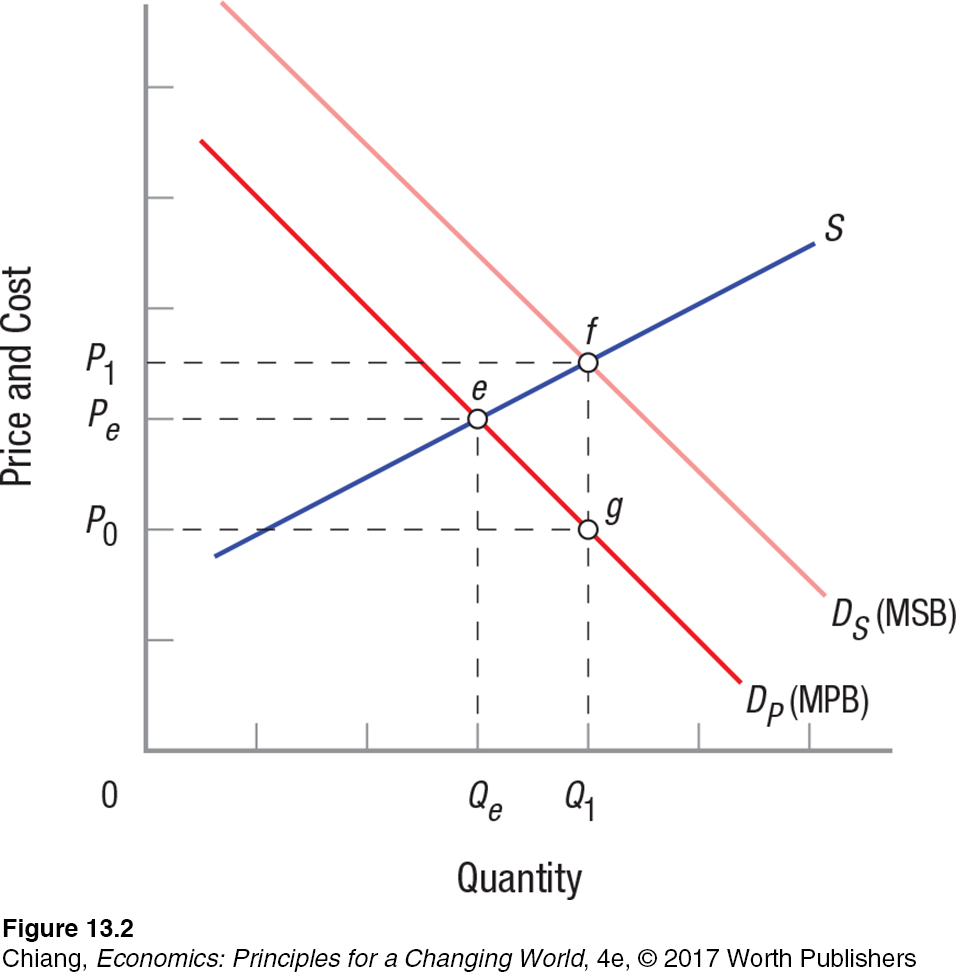
FIGURE 2 THE POSITIVE EXTERNALITY CASE
 Market supply curve S and private demand curve DP represent the market for college education. Equilibrium is at point e, and the number of students enrolled is Qe. Society would benefit, however, if more people would go to college. Demand curve DS represents the marginal social benefit (MSB), which includes the private demand for college education plus the external benefits that flow from it. Socially optimal enrollment would be Q1 (point f).
